| Measure | Value (anomaly) | Time |
Month cumul. | Record High | Record Low |
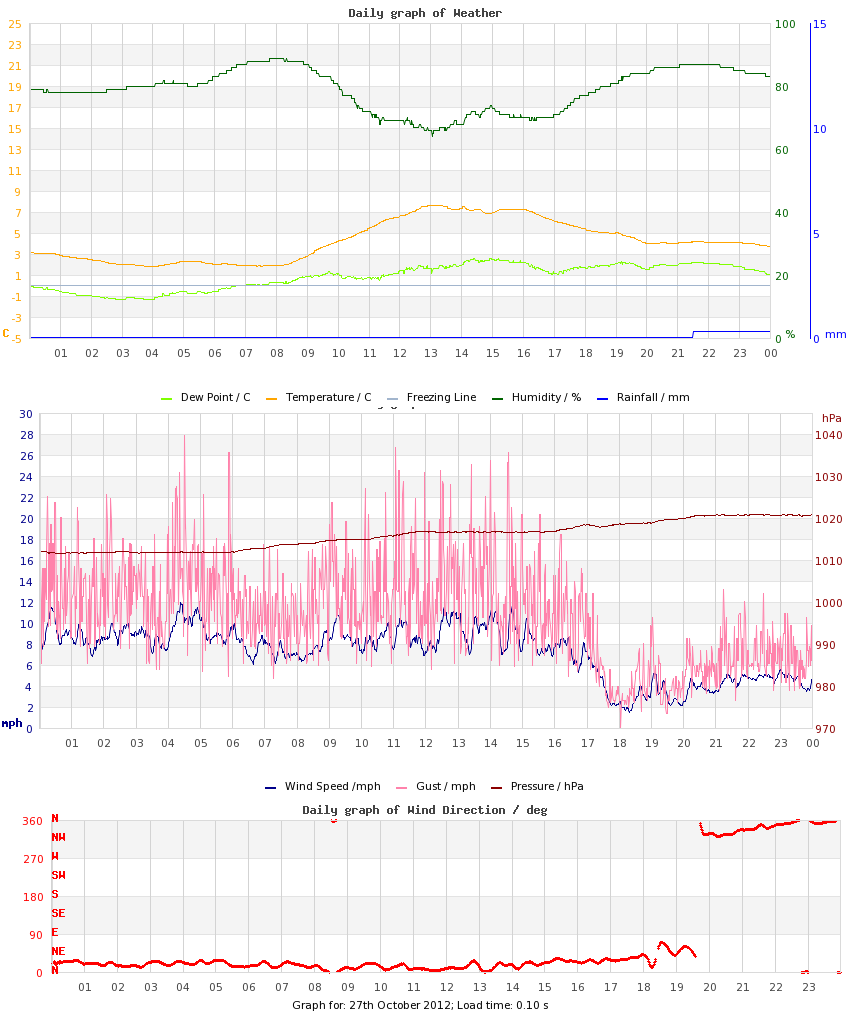
| Minimum Temperature |
1.8 °C (-5.6) |
07:30 |
8.1 °C (-0.5) |
14.1 °C (+6.7), 2021 |
1.8 °C (-5.6), 2012 |
| Maximum Temperature |
7.6 °C (-5.6) |
13:07 |
13.8 °C (-1.1) |
19.8 °C (+6.6), 2022 |
6.6 °C (-6.6), 2018 |
| Mean Temperature |
4.3 °C (-5.6) |
|
11.1 °C (-0.8) |
16.2 °C, 2022 |
4.3 °C, 2012 |
| Minimum Humidity |
64% |
13:02 |
70% |
81%, 2011 |
56%, 2013 |
| Maximum Humidity |
89% |
08:02 |
95% |
98%, 2023 |
88%, 2016 |
| Mean Humidity |
79% |
|
85% |
91%, 2023 |
78%, 2016 |
| Minimum Pressure |
1011 hPa |
01:26 |
1007 hPa |
1030 hPa, 2016 |
990 hPa, 2013 |
| Maximum Pressure |
1021 hPa |
22:00 |
1014 hPa |
1035 hPa, 2017 |
992 hPa, 2023 |
| Mean Pressure |
1016 hPa |
|
1011 hPa |
1032 hPa, 2017 |
991 hPa, 2023 |
| Mean Wind Speed |
7.3 mph (+3.2) |
|
4.5 mph (+0.4) |
9.0 mph, 2021 |
2.2 mph, 2019 |
| Maximum Wind Speed |
17.6 mph |
04:20 |
11.7 mph |
20.6 mph, 2013 |
7.7 mph, 2017 |
| Maximum Gust |
27.9 mph |
04:30 |
17.4 mph |
33.9 mph, 2013 |
11.2 mph, 2009 |
| Mean Wind Direction |
NNE |
|
|
|
|
| Rainfall |
0.3 mm |
|
82.6 mm (146%) |
8.9 mm, 2013 |
|
| Maximum Hourly Rain |
0.3 mm |
|
|
3.3 mm, 2013 |
|
| Maximum 10-min Rain |
n/a |
|
|
1.2, 2013 |
|
| Maximum Rain Rate |
n/a |
|
|
18, 2020 |
|
| Minimum Dew Point |
-1.3 °C |
03:25 |
6.1 °C |
11.5 °C, 2022 |
-1.3 °C, 2012 |
| Maximum Dew Point |
2.6 °C |
14:47 |
11.2 °C |
16.3 °C, 2022 |
2.6 °C, 2012 |
| Mean Dew Point |
0.9 °C |
|
8.5 °C |
14.3 °C, 2022 |
0.9 °C, 2012 |
| Measure | Value | Time |
Month cumul. | Record High | Record Low |
| Night Minimum (21-09) |
1.8 °C |
07:30 |
8.8 °C |
14.1 °C, 2021 |
1.8 °C, 2012 |
| Day Maximum (09-21) |
7.6 °C |
13:07 |
13.6 °C |
19.8 °C, 2022 |
6.6 °C, 2018 |
| Max 10m Temp Rise |
0.4 °C |
11:23 |
0.4 °C |
0.8 °C, 2009 |
0.2 °C, 2011 |
| Max 1hr Temp Rise |
1.5 °C |
09:21 |
1.5 °C |
2.2 °C, 2009 |
0.8 °C, 2011 |
| Max 1hr Hum Rise |
7% |
17:48 |
6% |
11%, 2013 |
3%, 2015 |
| Max 10m Temp Fall |
0.4 °C |
14:45 |
0.4 °C |
1.0 °C, 2009 |
0.2 °C, 2014 |
| Max 1hr Temp Fall |
1.2 °C |
16:59 |
1.3 °C |
2.6 °C, 2009 |
0.8 °C, 2015 |
| Max 1hr Hum Fall |
10% |
10:36 |
9% |
13%, 2016 |
3%, 2018 |
| Max 10m Wind Speed |
12.0 mph |
04:23 |
8.7 mph |
15.3 mph, 2013 |
5.1 mph, 2009 |
| Minimum Feels-like |
-5.1 °C |
04:30 |
7.0 °C |
16.2 °C, 2021 |
-5.1 °C, 2012 |
| Maximum Feels-like |
5.8 °C |
12:53 |
15.2 °C |
24.5 °C, 2022 |
5.8 °C, 2012 |
| Mean Feels-like |
0.7 °C |
|
11.8 °C |
19.8 °C, 2022 |
0.7 °C, 2012 |
| Air-frost Hrs |
0 hrs |
|
0 hrs |
0 hrs, 2009 |
0 hrs, 2009 |
| Measure | Value (anomaly) |
Month cumul. | Record High | Record Low |
| Temperature Range |
5.8 °C (+0.0) |
5.6 °C (-0.5) |
7.2 °C (+1.4), 2022 |
2.6 °C (-3.2), 2011 |
| Humidity Range |
25% |
26% |
38%, 2013 |
11%, 2011 |
| Pressure Range |
10 hPa |
7 hPa |
10 hPa, 2012 |
2 hPa, 2023 |
| Measure | Value [% of max] |
Month cumul. | Record High | Record Low |
| Sun Hours |
5 [56%] | 77 hrs (74%) [30%] |
9.4 [106%], 2017 |
0 [0%], 2011 |
| Wet Hours |
0.5 | 85 hrs (199%) [13%] |
6, 2020 |
0, 2010 |
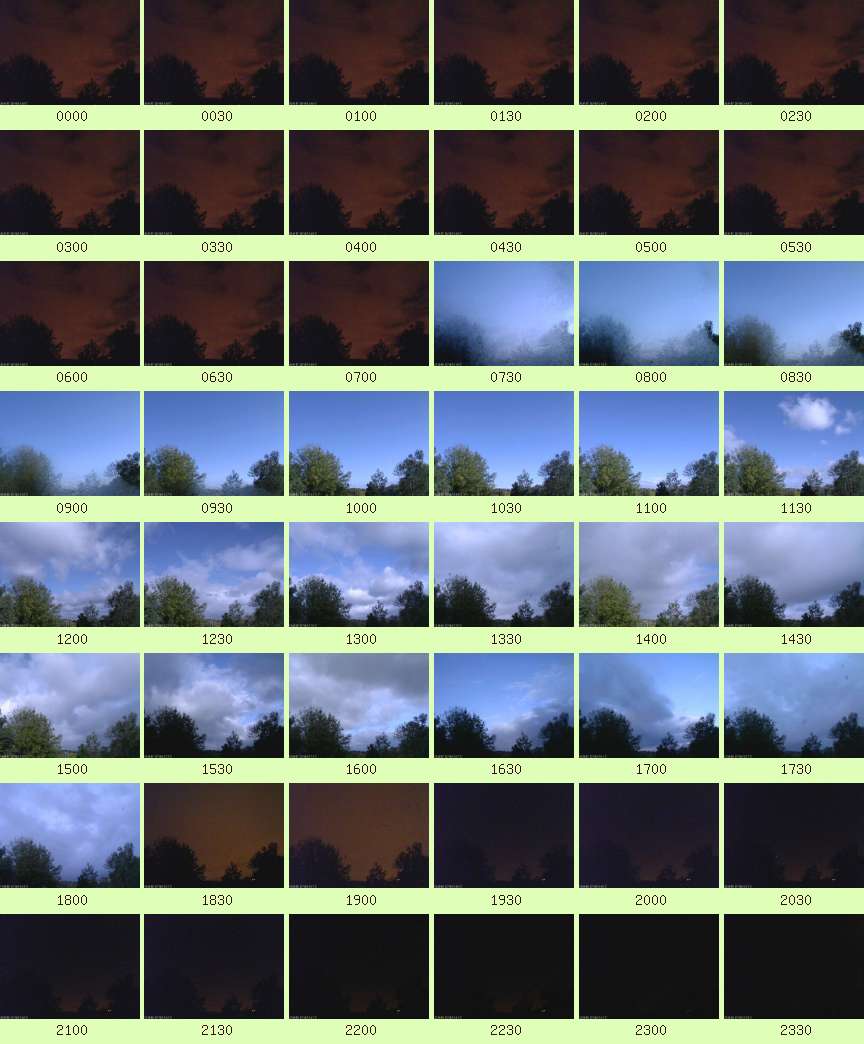
| Cloud Cover |
am: Sunny transitioned to Mostly Sunny
pm: Mostly Cloudy |
| Events |
None |
| Comments |
13-19 brief occasional Light Showers |
| Extra Comments |
delayed rain tip due to earlier rain |
| Issues |
Webcam not available pre 0720 |
| Observer Absent? |
No |
| Pond Temperature (Heath) |
0.0 °C |