| Measure | Value (anomaly) | Time |
Month cumul. | Record High | Record Low |
| Minimum Temperature |
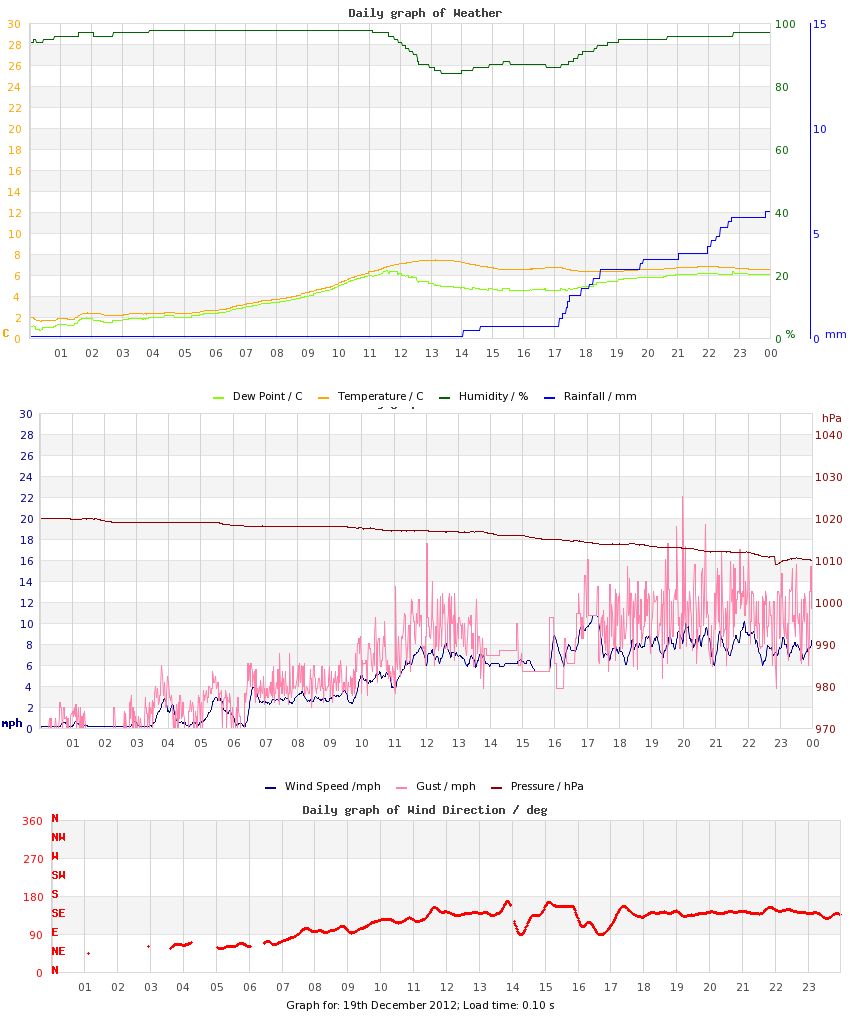
1.6 °C (-1.8) |
00:20 |
1.0 °C (-2.7) |
13.2 °C (+9.8), 2015 |
-5.3 °C (-8.7), 2010 |
| Maximum Temperature |
7.5 °C (-0.2) |
13:08 |
6.2 °C (-2.1) |
16.0 °C (+8.3), 2015 |
0.1 °C (-7.6), 2010 |
| Mean Temperature |
5.0 °C (-1.0) |
|
3.8 °C (-2.4) |
14.8 °C, 2015 |
-2.6 °C, 2010 |
| Minimum Humidity |
84% |
13:38 |
74% |
93%, 2021 |
57%, 2014 |
| Maximum Humidity |
98% |
07:28 |
94% |
98%, 2012 |
82%, 2016 |
| Mean Humidity |
94% |
|
86% |
96%, 2021 |
76%, 2014 |
| Minimum Pressure |
1010 hPa |
22:50 |
1004 hPa |
1034 hPa, 2017 |
988 hPa, 2019 |
| Maximum Pressure |
1020 hPa |
00:54 |
1015 hPa |
1039 hPa, 2021 |
1000 hPa, 2010 |
| Mean Pressure |
1016 hPa |
|
1010 hPa |
1035 hPa, 2021 |
996 hPa, 2010 |
| Mean Wind Speed |
4.8 mph (-0.3) |
|
4.5 mph (-0.6) |
11.9 mph, 2022 |
0.5 mph, 2016 |
| Maximum Wind Speed |
15.4 mph |
19:58 |
12.0 mph |
21.7 mph, 2022 |
4.7 mph, 2016 |
| Maximum Gust |
22.1 mph |
19:58 |
17.7 mph |
34.6 mph, 2022 |
6.3 mph, 2016 |
| Mean Wind Direction |
SE |
|
|
|
|
| Rainfall |
6.0 mm |
|
29.5 mm (84%) |
11.0 mm, 2023 |
|
| Maximum Hourly Rain |
2.0 mm |
18:08 |
|
3.7 mm, 2013 |
|
| Maximum 10-min Rain |
0.9 mm |
17:30 |
|
2.0 mm, 2014 |
|
| Maximum Rain Rate |
6 mm/h |
17:25 |
|
30 mm/h, 2014 |
|
| Minimum Dew Point |
0.7 °C |
00:20 |
-0.9 °C |
9.4 °C, 2015 |
-8.0 °C, 2010 |
| Maximum Dew Point |
6.4 °C |
11:34 |
4.2 °C |
13.5 °C, 2015 |
-1.6 °C, 2010 |
| Mean Dew Point |
4.2 °C |
|
1.5 °C |
11.2 °C, 2015 |
-4.4 °C, 2010 |
| Measure | Value | Time |
Month cumul. | Record High | Record Low |
| Night Minimum (21-09) |
1.6 °C |
00:20 |
1.3 °C |
12.6 °C, 2015 |
-4.3 °C, 2010 |
| Day Maximum (09-21) |
7.5 °C |
13:08 |
6.2 °C |
16.0 °C, 2015 |
0.1 °C, 2010 |
| Max 10m Temp Rise |
0.3 °C |
10:05 |
0.3 °C |
0.3 °C, 2010 |
0.1 °C, 2023 |
| Max 1hr Temp Rise |
1.3 °C |
10:43 |
1.3 °C |
1.4 °C, 2017 |
0.1 °C, 2023 |
| Max 1hr Hum Rise |
6% |
18:22 |
5% |
9%, 2013 |
1%, 2021 |
| Max 10m Temp Fall |
0.3 °C |
00:11 |
0.3 °C |
0.9 °C, 2013 |
0.2 °C, 2015 |
| Max 1hr Temp Fall |
0.6 °C |
14:35 |
1.0 °C |
2.1 °C, 2013 |
0.4 °C, 2016 |
| Max 1hr Hum Fall |
10% |
12:35 |
9% |
17%, 2014 |
2%, 2016 |
| Max 10m Wind Speed |
10.7 mph |
17:11 |
9.0 mph |
16.6 mph, 2022 |
2.5 mph, 2016 |
| Minimum Feels-like |
-0.5 °C |
03:46 |
-2.3 °C |
14.9 °C, 2015 |
-9.8 °C, 2010 |
| Maximum Feels-like |
6.3 °C |
13:47 |
5.6 °C |
18.6 °C, 2015 |
0.0 °C, 2010 |
| Mean Feels-like |
3.1 °C |
|
1.5 °C |
16.7 °C, 2015 |
-5.9 °C, 2010 |
| Air-frost Hrs |
0 hrs |
|
3 hrs |
23 hrs, 2010 |
0 hrs, 2012 |
| Measure | Value (anomaly) |
Month cumul. | Record High | Record Low |
| Temperature Range |
5.9 °C (+1.6) |
5.3 °C (+0.7) |
7.6 °C (+3.3), 2014 |
1.9 °C (-2.4), 2016 |
| Humidity Range |
14% |
20% |
34%, 2014 |
3%, 2016 |
| Pressure Range |
10 hPa |
11 hPa |
18 hPa, 2013 |
2 hPa, 2017 |
| Measure | Value [% of max] |
Month cumul. | Record High | Record Low |
| Sun Hours |
0 [0%] | 55 hrs (138%) [41%] |
6.5 [93%], 2009 |
0 [0%], 2010 |
| Wet Hours |
7
[Mean rain rate: 0.9 mm/h] | 29 hrs (76%) [6.3%] |
11, 2023 |
0, 2009 |
| Cloud Cover |
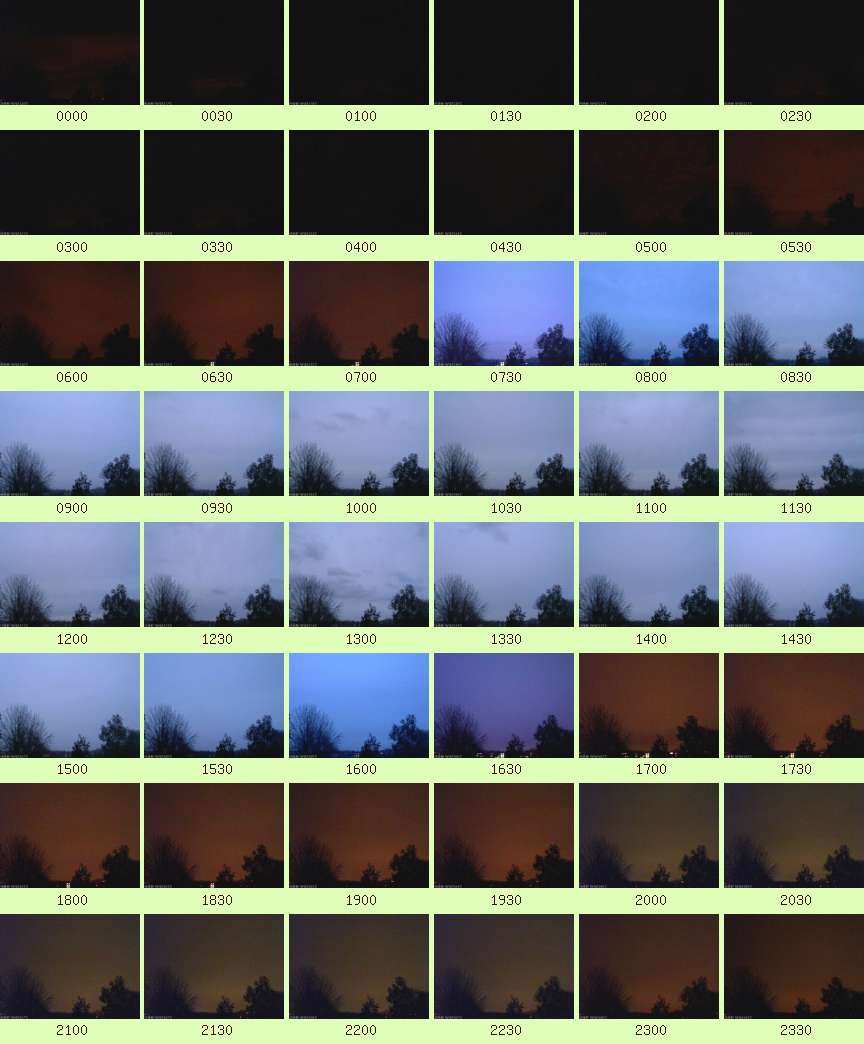
Overcast |
| Events |
None |
| Comments |
13-15, 17- Light Rain with breaks (17-18 Moderate) |
| Extra Comments |
|
| Issues |
some 14-17 wind data loss |
| Observer Absent? |
No |
| Pond Temperature (Heath) |
0.0 °C |