| Measure | Value (anomaly) | Time |
Month cumul. | Record High | Record Low |
| Minimum Temperature |
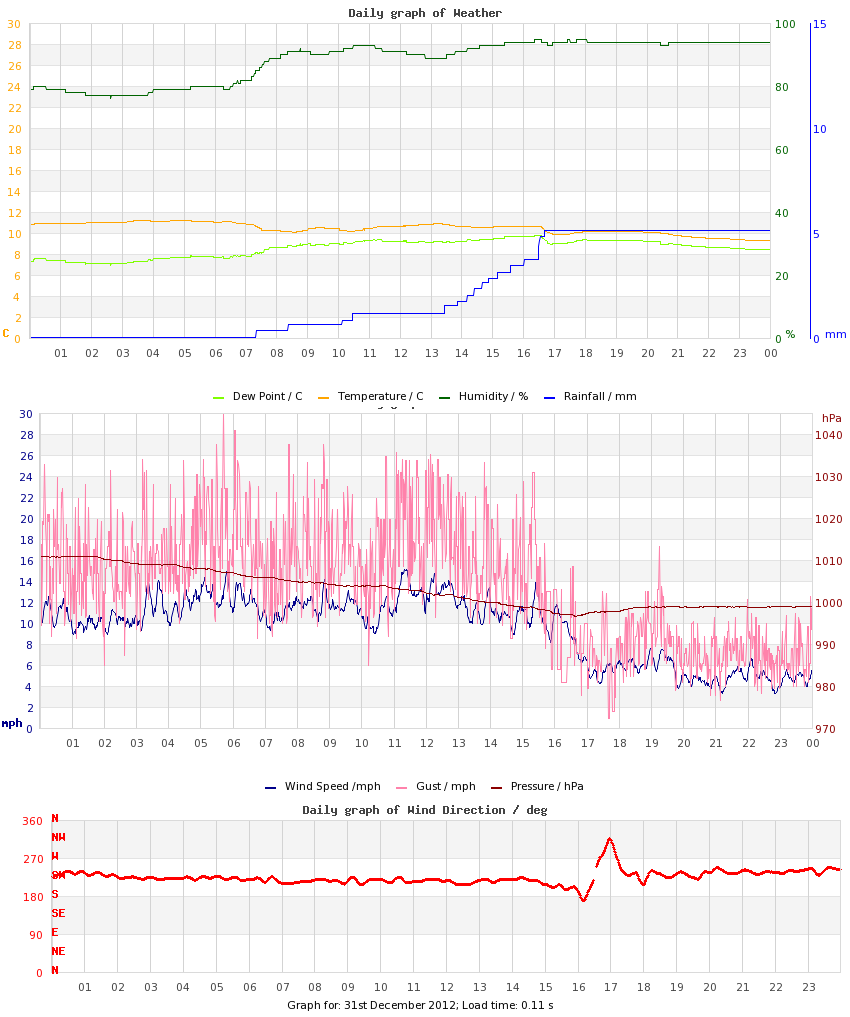
9.3 °C (+6.0) |
23:34 |
3.1 °C (-0.5) |
12.6 °C (+9.3), 2021 |
-1.8 °C (-5.1), 2020 |
| Maximum Temperature |
11.2 °C (+3.4) |
04:16 |
8.0 °C (-0.1) |
14.7 °C (+6.9), 2021 |
0.8 °C (-7.0), 2020 |
| Mean Temperature |
10.5 °C (+4.7) |
|
5.7 °C (-0.3) |
13.4 °C, 2021 |
-0.3 °C, 2020 |
| Minimum Humidity |
76% |
02:36 |
77% |
89%, 2020 |
62%, 2015 |
| Maximum Humidity |
95% |
17:11 |
94% |
98%, 2009 |
83%, 2016 |
| Mean Humidity |
88% |
|
87% |
95%, 2010 |
74%, 2015 |
| Minimum Pressure |
995 hPa |
16:14 |
1002 hPa |
1035 hPa, 2018 |
986 hPa, 2023 |
| Maximum Pressure |
1011 hPa |
00:53 |
1014 hPa |
1038 hPa, 2018 |
996 hPa, 2023 |
| Mean Pressure |
1003 hPa |
|
1008 hPa |
1036 hPa, 2018 |
990 hPa, 2023 |
| Mean Wind Speed |
9.5 mph (+4.4) |
|
5.4 mph (+0.3) |
10.7 mph, 2022 |
1.5 mph, 2010 |
| Maximum Wind Speed |
10.9 mph |
02:01 |
12.6 mph |
24.1 mph, 2023 |
6.4 mph, 2010 |
| Maximum Gust |
29.9 mph |
05:42 |
19.7 mph |
40.3 mph, 2022 |
8.1 mph, 2010 |
| Mean Wind Direction |
SW |
|
|
|
|
| Rainfall |
5.1 mm |
|
101.4 mm (178%) |
11.5 mm, 2023 |
|
| Maximum Hourly Rain |
1.7 mm |
16:32 |
|
5.1 mm, 2017 |
|
| Maximum 10-min Rain |
1.1 mm |
16:32 |
|
3.3 mm, 2017 |
|
| Maximum Rain Rate |
36 mm/h |
16:29 |
|
42 mm/h, 2015 |
|
| Minimum Dew Point |
6.9 °C |
02:36 |
1.1 °C |
10.6 °C, 2021 |
-2.9 °C, 2020 |
| Maximum Dew Point |
9.8 °C |
16:27 |
6.3 °C |
12.4 °C, 2021 |
-0.3 °C, 2020 |
| Mean Dew Point |
8.6 °C |
|
3.7 °C |
11.3 °C, 2021 |
-1.4 °C, 2020 |
| Measure | Value | Time |
Month cumul. | Record High | Record Low |
| Night Minimum (21-09) |
* 10.1 °C * |
08:33 |
3.6 °C |
12.6 °C, 2021 |
-1.8 °C, 2020 |
| Day Maximum (09-21) |
* 10.9 °C * |
13:12 |
7.9 °C |
14.7 °C, 2021 |
0.8 °C, 2020 |
| Max 10m Temp Rise |
0.2 °C |
11:14 |
0.3 °C |
0.5 °C, 2019 |
0.1 °C, 2009 |
| Max 1hr Temp Rise |
0.4 °C |
09:29 |
1.2 °C |
2.0 °C, 2022 |
0.3 °C, 2009 |
| Max 1hr Hum Rise |
8% |
07:44 |
4% |
11%, 2023 |
1%, 2010 |
| Max 10m Temp Fall |
0.4 °C |
16:41 |
0.3 °C |
1.4 °C, 2023 |
0.1 °C, 2010 |
| Max 1hr Temp Fall |
0.8 °C |
07:30 |
1.0 °C |
3.4 °C, 2023 |
0.3 °C, 2010 |
| Max 1hr Hum Fall |
2% |
01:09 |
8% |
9%, 2015 |
1%, 2016 |
| Max 10m Wind Speed |
15.1 mph |
11:19 |
10.1 mph |
16.5 mph, 2023 |
5.0 mph, 2010 |
| Minimum Feels-like |
6.5 °C |
23:57 |
-0.0 °C |
14.5 °C, 2021 |
-7.1 °C, 2020 |
| Maximum Feels-like |
11.8 °C |
13:04 |
7.9 °C |
17.1 °C, 2021 |
0.8 °C, 2020 |
| Mean Feels-like |
10.7 °C |
|
4.0 °C |
15.4 °C, 2021 |
-2.1 °C, 2020 |
| Air-frost Hrs |
0 hrs |
|
2 hrs |
13 hrs, 2020 |
0 hrs, 2009 |
| Measure | Value (anomaly) |
Month cumul. | Record High | Record Low |
| Temperature Range |
1.9 °C (-2.6) |
5.0 °C (+0.4) |
6.6 °C (+2.1), 2014 |
1.2 °C (-3.3), 2018 |
| Humidity Range |
19% |
17% |
26%, 2015 |
3%, 2016 |
| Pressure Range |
16 hPa |
12 hPa |
16 hPa, 2012 |
3 hPa, 2018 |
| Measure | Value [% of max] |
Month cumul. | Record High | Record Low |
| Sun Hours |
0 [0%] | 61 hrs (97%) [29%] |
6 [85%], 2015 |
0 [0%], 2010 |
| Wet Hours |
7
[Mean rain rate: 0.7 mm/h] | 101 hrs (162%) [14%] |
7, 2012 |
0, 2010 |
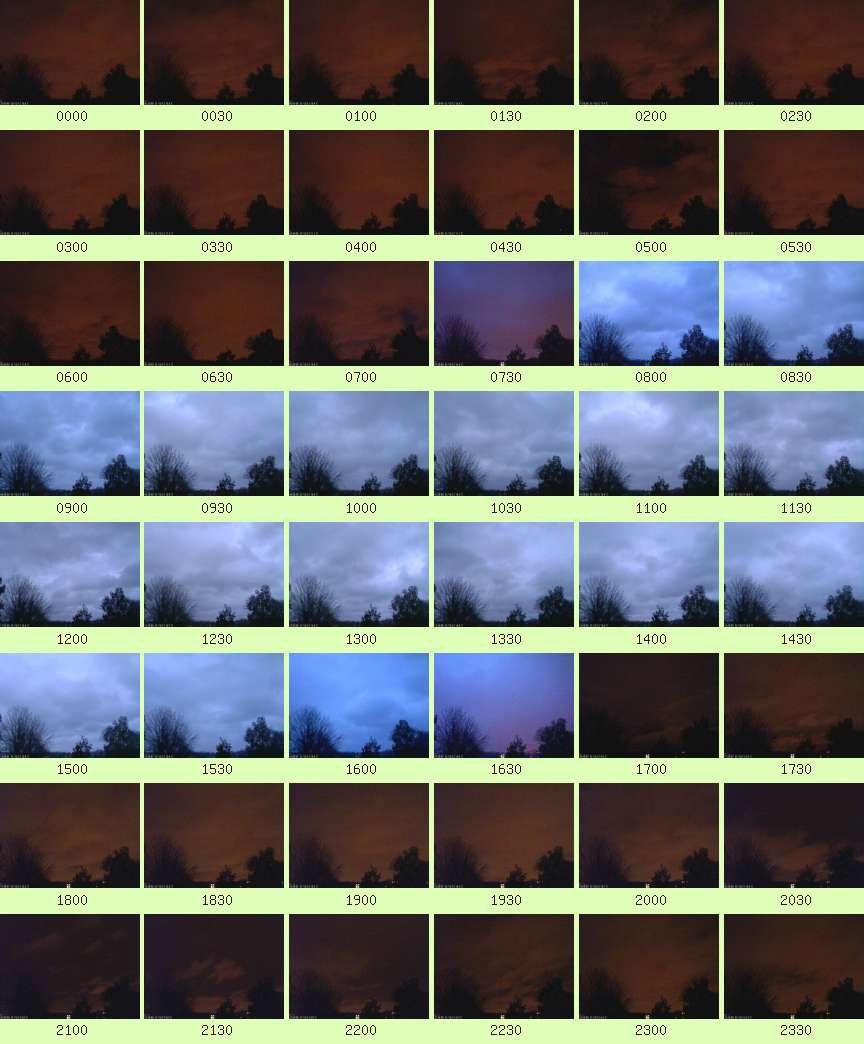
| Cloud Cover |
Overcast |
| Events |
None |
| Comments |
07-1330 broken, -17 Light Rain |
| Extra Comments |
|
| Issues |
None known |
| Observer Absent? |
Yes - observations may be unreliable |
| Pond Temperature (Heath) |
0.0 °C |