| Measure | Value (anomaly) | Time |
Month cumul. | Record High | Record Low |
| Minimum Temperature |
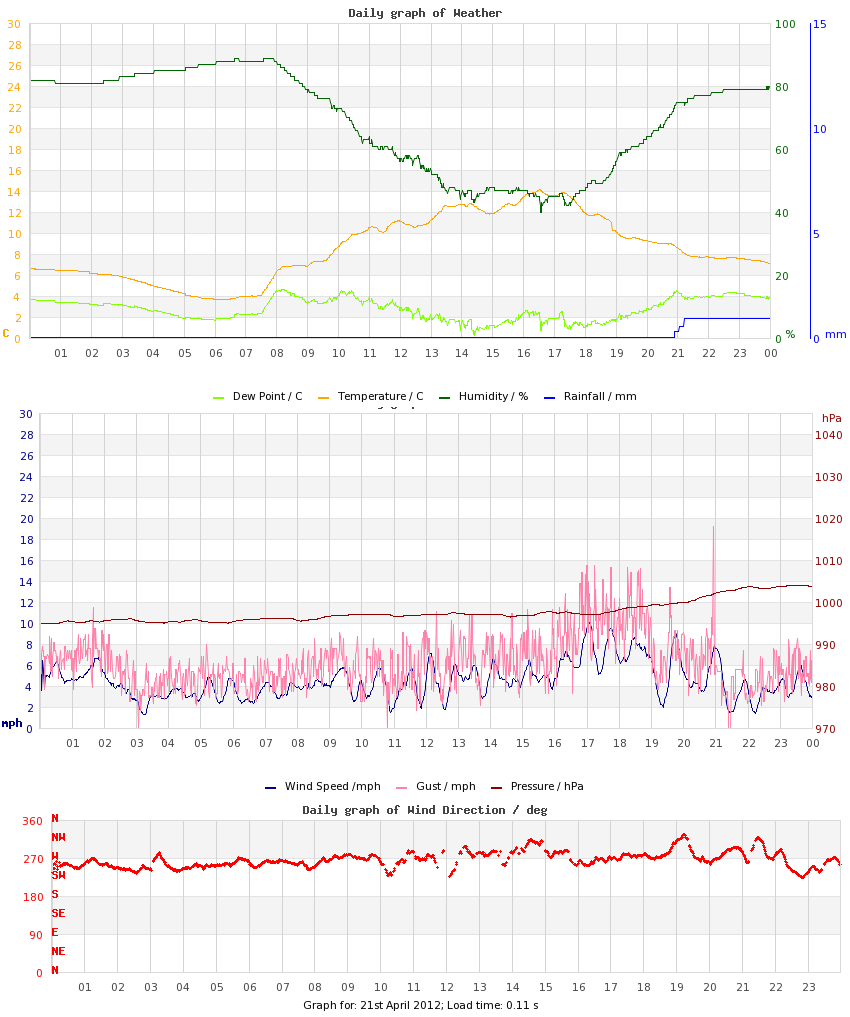
3.7 °C (-2.6) |
06:12 |
3.8 °C (-2.0) |
11.6 °C (+5.3), 2011 |
0.2 °C (-6.1), 2013 |
| Maximum Temperature |
14.2 °C (-0.7) |
16:30 |
12.3 °C (-1.8) |
24.4 °C (+9.5), 2011 |
11.4 °C (-3.5), 2023 |
| Mean Temperature |
8.5 °C (-1.6) |
|
8.0 °C (-1.9) |
17.5 °C, 2011 |
7.9 °C, 2010 |
| Minimum Humidity |
40% |
16:32 |
49% |
68%, 2023 |
29%, 2019 |
| Maximum Humidity |
89% |
07:14 |
89% |
98%, 2014 |
66%, 2011 |
| Mean Humidity |
69% |
|
70% |
85%, 2023 |
48%, 2011 |
| Minimum Pressure |
994 hPa |
04:03 |
1001 hPa |
1032 hPa, 2015 |
994 hPa, 2012 |
| Maximum Pressure |
1002 hPa |
22:43 |
1010 hPa |
1034 hPa, 2015 |
1002 hPa, 2012 |
| Mean Pressure |
998 hPa |
|
1005 hPa |
1033 hPa, 2015 |
998 hPa, 2012 |
| Mean Wind Speed |
5.2 mph (+0.3) |
|
4.8 mph (-0.1) |
7.9 mph, 2020 |
1.9 mph, 2009 |
| Maximum Wind Speed |
13.0 mph |
|
13.5 mph |
18.0 mph, 2020 |
9.4 mph, 2010 |
| Maximum Gust |
22.1 mph |
20:54 |
19.3 mph |
30.0 mph, 2020 |
12.7 mph, 2018 |
| Mean Wind Direction |
W |
|
|
|
|
| Rainfall |
0.9 mm |
|
45.4 mm (154%) |
4.4 mm, 2014 |
|
| Maximum Hourly Rain |
0.9 mm |
21:12 |
|
2.2 mm, 2014 |
|
| Maximum 10-min Rain |
0.6 mm |
21:12 |
|
0.9 mm, 2014 |
|
| Maximum Rain Rate |
2.7 mm/h |
21:13 |
|
11 mm/h, 2014 |
|
| Minimum Dew Point |
0.2 °C |
14:24 |
-0.7 °C |
8.7 °C, 2018 |
-3.7 °C, 2010 |
| Maximum Dew Point |
4.6 °C |
08:11 |
5.8 °C |
14.1 °C, 2018 |
0.7 °C, 2010 |
| Mean Dew Point |
2.8 °C |
|
2.6 °C |
11.2 °C, 2018 |
-1.6 °C, 2010 |
| Measure | Value | Time |
Month cumul. | Record High | Record Low |
| Night Minimum (21-09) |
3.7 °C |
06:11 |
4.1 °C |
11.6 °C, 2011 |
0.2 °C, 2013 |
| Day Maximum (09-21) |
14.2 °C |
16:30 |
12.3 °C |
24.4 °C, 2011 |
11.4 °C, 2023 |
| Max 10m Temp Rise |
0.9 °C |
07:50 |
0.8 °C |
1.4 °C, 2013 |
0.4 °C, 2017 |
| Max 1hr Temp Rise |
2.8 °C |
08:29 |
2.7 °C |
5.7 °C, 2013 |
1.3 °C, 2017 |
| Max 1hr Hum Rise |
12% |
19:28 |
12% |
20%, 2014 |
4%, 2017 |
| Max 10m Temp Fall |
0.9 °C |
18:58 |
0.8 °C |
0.9 °C, 2012 |
0.3 °C, 2019 |
| Max 1hr Temp Fall |
2.4 °C |
19:22 |
2.2 °C |
2.9 °C, 2014 |
1.5 °C, 2017 |
| Max 1hr Hum Fall |
12% |
10:39 |
14% |
25%, 2014 |
8%, 2010 |
| Max 10m Wind Speed |
10.1 mph |
17:02 |
9.2 mph |
13.3 mph, 2020 |
6.9 mph, 2018 |
| Minimum Feels-like |
1.0 °C |
06:22 |
1.3 °C |
11.7 °C, 2018 |
-0.9 °C, 2013 |
| Maximum Feels-like |
14.2 °C |
16:29 |
12.2 °C |
26.2 °C, 2018 |
11.4 °C, 2023 |
| Mean Feels-like |
7.4 °C |
|
7.0 °C |
18.8 °C, 2018 |
6.4 °C, 2010 |
| Air-frost Hrs |
0 hrs |
|
0.2 hrs |
0 hrs, 2009 |
0 hrs, 2009 |
| Measure | Value (anomaly) |
Month cumul. | Record High | Record Low |
| Temperature Range |
10.5 °C (+1.9) |
8.4 °C (+0.2) |
16.2 °C (+7.6), 2019 |
5.4 °C (-3.2), 2023 |
| Humidity Range |
49% |
40% |
58%, 2014 |
24%, 2023 |
| Pressure Range |
8 hPa |
9 hPa |
14 hPa, 2019 |
2 hPa, 2010 |
| Measure | Value [% of max] |
Month cumul. | Record High | Record Low |
| Sun Hours |
5 [39%] | 89 hrs (80%) [34%] |
13 [101%], 2019 |
0 [0%], 2017 |
| Wet Hours |
1
[Mean rain rate: 0.9 mm/h] | 49 hrs (153%) [9.8%] |
4, 2014 |
0, 2009 |
| Cloud Cover |
Partly Cloudy with periods of Mostly Sunny |
| Events |
Hail: small stones |
| Comments |
12 Slight Hail ; 19, 21 Light Showers |
| Extra Comments |
|
| Issues |
None known |
| Observer Absent? |
No |
| Pond Temperature (Heath) |
0.0 °C |