| Measure | Value (anomaly) | Time |
Month cumul. | Record High | Record Low |
| Minimum Temperature |
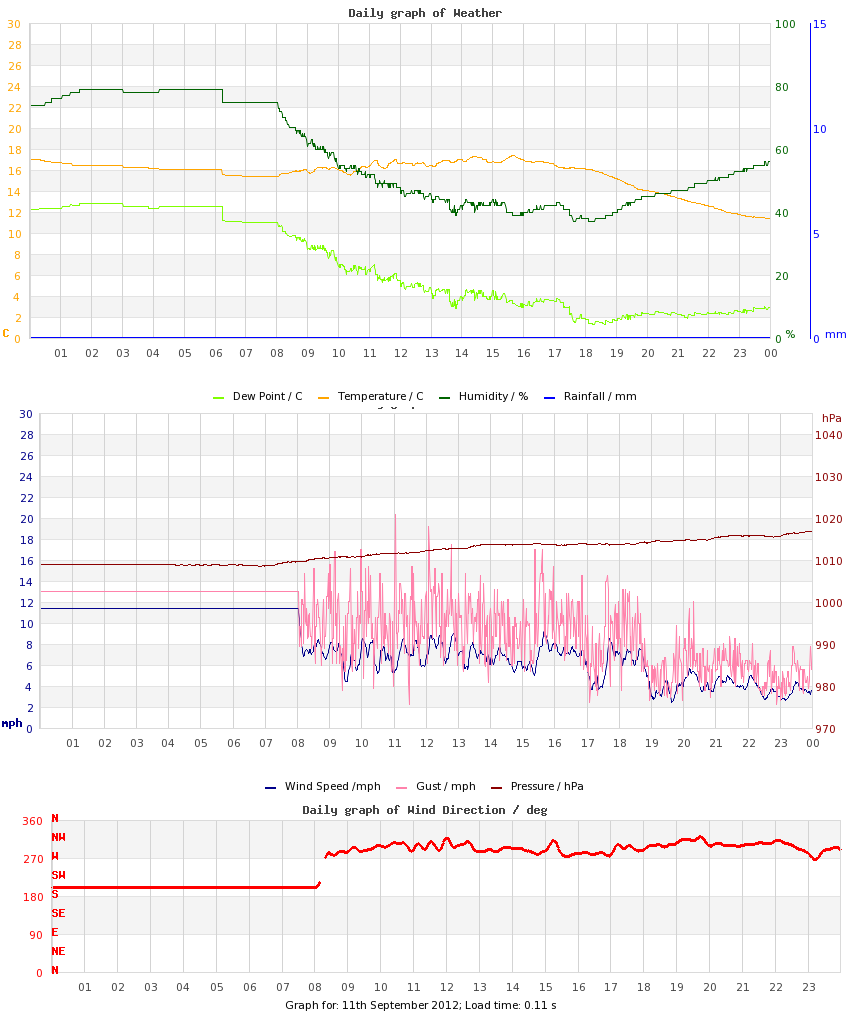
11.4 °C (-0.5) |
23:59 |
12.0 °C (-0.3) |
19.3 °C (+7.4), 2023 |
8.1 °C (-3.8), 2020 |
| Maximum Temperature |
17.4 °C (-2.2) |
15:39 |
22.6 °C (+2.2) |
25.1 °C (+5.5), 2023 |
16.3 °C (-3.3), 2013 |
| Mean Temperature |
15.6 °C (-1.4) |
|
17.2 °C (+1.0) |
21.7 °C, 2023 |
13.6 °C, 2013 |
| Minimum Humidity |
37% |
17:56 |
43% |
76%, 2018 |
37%, 2012 |
| Maximum Humidity |
79% |
03:54 |
85% |
97%, 2022 |
79%, 2012 |
| Mean Humidity |
58% |
|
65% |
84%, 2022 |
58%, 2012 |
| Minimum Pressure |
1009 hPa |
06:03 |
1019 hPa |
1034 hPa, 2009 |
991 hPa, 2017 |
| Maximum Pressure |
1017 hPa |
23:30 |
1024 hPa |
1038 hPa, 2009 |
1001 hPa, 2017 |
| Mean Pressure |
1012 hPa |
|
1021 hPa |
1036 hPa, 2009 |
994 hPa, 2017 |
| Mean Wind Speed |
7.0 mph (+3.1) |
|
4.2 mph (+0.3) |
8.3 mph, 2017 |
2.1 mph, 2020 |
| Maximum Wind Speed |
12.5 mph |
09:58 |
10.3 mph |
21.5 mph, 2011 |
7.4 mph, 2014 |
| Maximum Gust |
20.4 mph |
11:01 |
15.3 mph |
31.7 mph, 2011 |
9.8 mph, 2014 |
| Mean Wind Direction |
W |
|
|
|
|
| Rainfall |
0.0 mm |
|
0.0 mm (0%) |
7.7 mm, 2017 |
|
| Maximum Hourly Rain |
n/a |
|
|
5.5, 2017 |
|
| Maximum 10-min Rain |
n/a |
|
|
3.5, 2017 |
|
| Maximum Rain Rate |
n/a |
|
|
53, 2017 |
|
| Minimum Dew Point |
1.3 °C |
18:14 |
6.6 °C |
16.1 °C, 2023 |
1.3 °C, 2012 |
| Maximum Dew Point |
12.8 °C |
02:17 |
13.3 °C |
18.3 °C, 2023 |
11.2 °C, 2020 |
| Mean Dew Point |
6.8 °C |
|
9.9 °C |
17.5 °C, 2023 |
6.8 °C, 2012 |
| Measure | Value | Time |
Month cumul. | Record High | Record Low |
| Night Minimum (21-09) |
* 15.4 °C * |
07:30 |
12.4 °C |
19.3 °C, 2023 |
8.1 °C, 2020 |
| Day Maximum (09-21) |
17.4 °C |
15:40 |
22.6 °C |
25.1 °C, 2023 |
16.3 °C, 2013 |
| Max 10m Temp Rise |
n/a |
00:48 |
0.7 °C |
1, 2016 |
0.3, 2018 |
| Max 1hr Temp Rise |
n/a |
01:17 |
2.8 °C |
3.7, 2016 |
1.3, 2018 |
| Max 1hr Hum Rise |
n/a |
19:36 |
9% |
20, 2015 |
4, 2010 |
| Max 10m Temp Fall |
n/a |
00:17 |
0.5 °C |
0.9, 2016 |
0.2, 2010 |
| Max 1hr Temp Fall |
n/a |
19:41 |
2.0 °C |
3.2, 2016 |
1.1, 2010 |
| Max 1hr Hum Fall |
14% |
08:58 |
13% |
28%, 2016 |
4%, 2018 |
| Max 10m Wind Speed |
10.0 mph |
|
7.7 mph |
14.4 mph, 2017 |
4.3 mph, 2014 |
| Minimum Feels-like |
11.4 °C |
23:49 |
12.7 °C |
24.6 °C, 2023 |
7.3 °C, 2016 |
| Maximum Feels-like |
19.5 °C |
00:17 |
24.4 °C |
30.8 °C, 2023 |
17.4 °C, 2013 |
| Mean Feels-like |
16.5 °C |
|
18.8 °C |
27.3 °C, 2023 |
14.7 °C, 2013 |
| Air-frost Hrs |
0 hrs |
|
0 hrs |
0 hrs, 2009 |
0 hrs, 2009 |
| Measure | Value (anomaly) |
Month cumul. | Record High | Record Low |
| Temperature Range |
6.0 °C (-1.7) |
10.6 °C (+2.5) |
12.5 °C (+4.8), 2016 |
4.5 °C (-3.2), 2010 |
| Humidity Range |
42% |
42% |
51%, 2015 |
13%, 2019 |
| Pressure Range |
8 hPa |
5 hPa |
10 hPa, 2017 |
2 hPa, 2013 |
| Measure | Value [% of max] |
Month cumul. | Record High | Record Low |
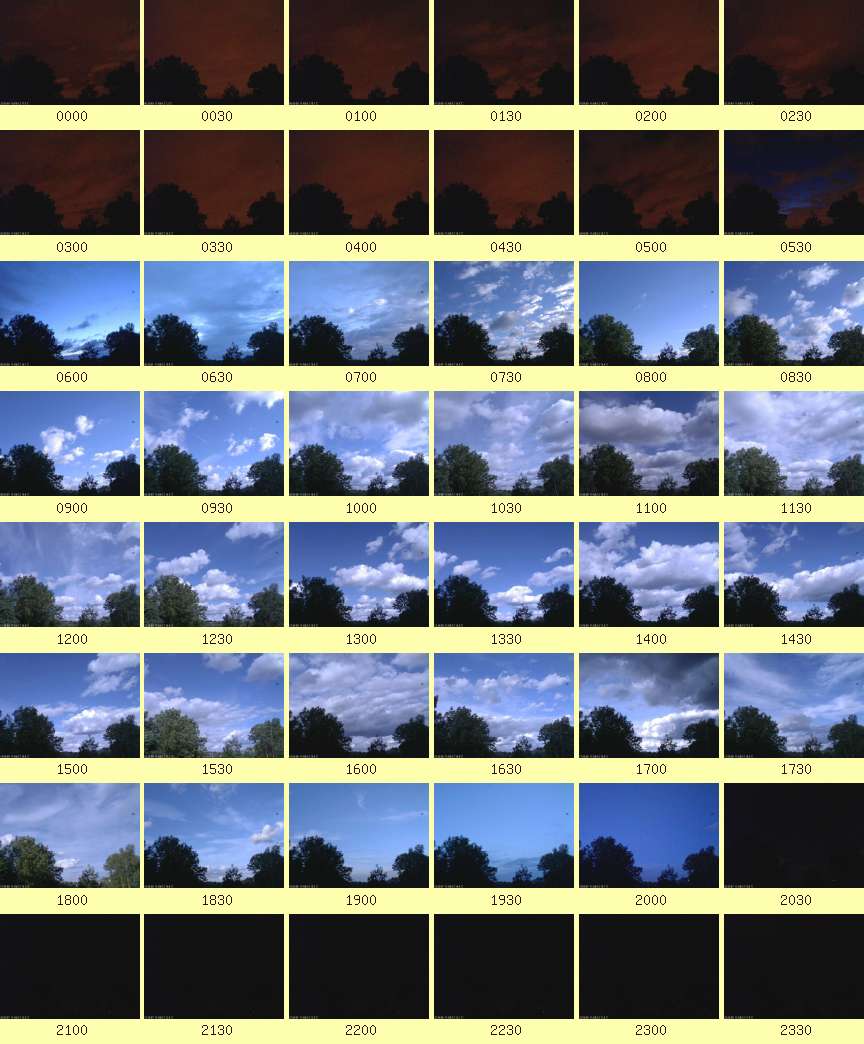
| Sun Hours |
6 [51%] | 83 hrs (147%) [63%] |
11.7 [100%], 2016 |
0 [0%], 2014 |
| Wet Hours |
0.1 | 0.2 hrs (1%) [0.1%] |
4, 2013 |
0, 2009 |
| Cloud Cover |
am: Mostly Sunny transitioned to Partly Cloudy
pm: Partly Cloudy |
| Events |
None |
| Comments |
possible 01 Shower |
| Extra Comments |
|
| Issues |
10th-11th, 1330-08 Data Loss (Wind: total; Other: partial). Some glitchy periods reconstructed. |
| Observer Absent? |
Yes - observations may be unreliable |
| Pond Temperature (Heath) |
0.0 °C |