| Measure | Value (anomaly) | Time |
Month cumul. | Record High | Record Low |
| Minimum Temperature |
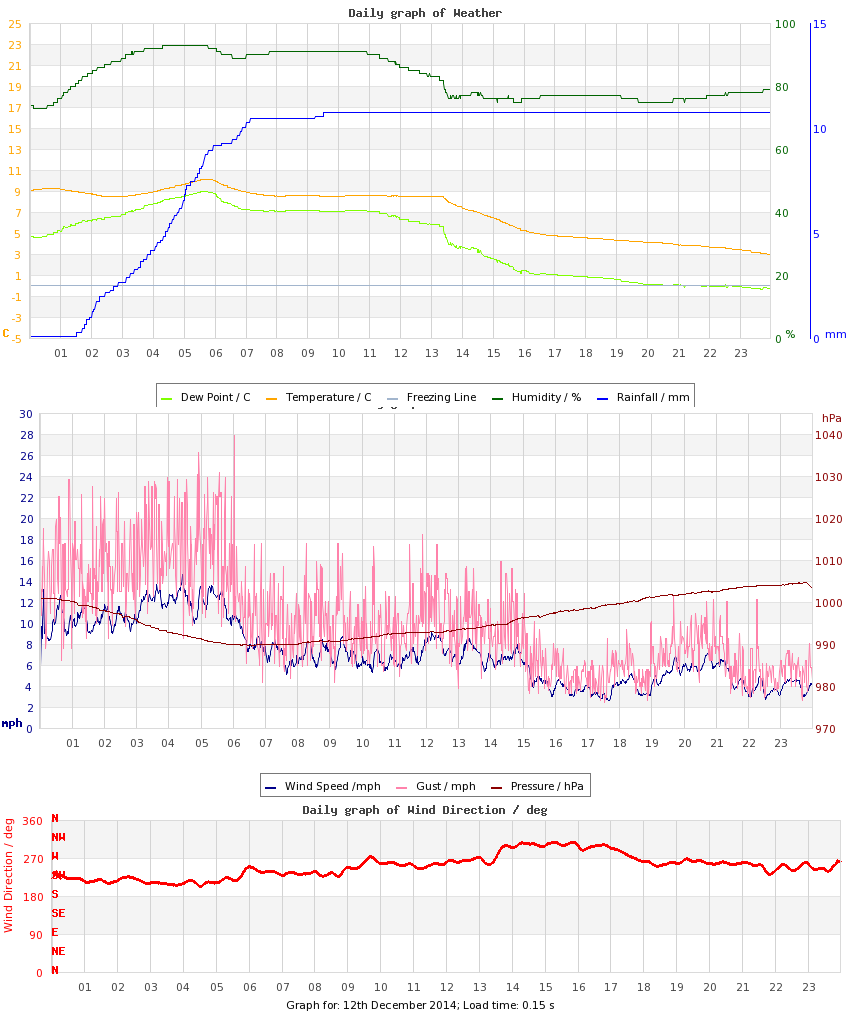
3.0 °C (-0.7) |
23:56 |
3.3 °C (-0.6) |
10.5 °C (+6.8), 2021 |
-4.7 °C (-8.4), 2012 |
| Maximum Temperature |
10.1 °C (+1.8) |
05:43 |
8.3 °C (-0.4) |
13.2 °C (+4.9), 2015 |
0.8 °C (-7.5), 2022 |
| Mean Temperature |
7.1 °C (+0.6) |
|
5.6 °C (-0.5) |
11.7 °C, 2021 |
-1.1 °C, 2012 |
| Minimum Humidity |
73% |
00:20 |
69% |
97%, 2013 |
63%, 2018 |
| Maximum Humidity |
93% |
05:01 |
92% |
98%, 2009 |
88%, 2015 |
| Mean Humidity |
83% |
|
83% |
98%, 2013 |
79%, 2018 |
| Minimum Pressure |
990 hPa |
06:34 |
1012 hPa |
1029 hPa, 2009 |
972 hPa, 2019 |
| Maximum Pressure |
1005 hPa |
23:24 |
1021 hPa |
1033 hPa, 2009 |
1004 hPa, 2019 |
| Mean Pressure |
996 hPa |
|
1016 hPa |
1031 hPa, 2009 |
989 hPa, 2019 |
| Mean Wind Speed |
7.1 mph (+2.0) |
|
5.9 mph (+0.8) |
7.8 mph, 2015 |
1.1 mph, 2012 |
| Maximum Wind Speed |
17.8 mph |
05:13 |
14.8 mph |
22.5 mph, 2011 |
6.8 mph, 2016 |
| Maximum Gust |
27.9 mph |
06:02 |
21.5 mph |
40.9 mph, 2011 |
9.7 mph, 2012 |
| Mean Wind Direction |
WSW |
|
|
|
|
| Rainfall |
10.7 mm |
|
16.3 mm (74%) |
11.0 mm, 2023 |
|
| Maximum Hourly Rain |
3.0 mm |
05:46 |
|
3.0 mm, 2014 |
|
| Maximum 10-min Rain |
1.1 mm |
05:05 |
|
1.1 mm, 2014 |
|
| Maximum Rain Rate |
18 mm/h |
03:35 |
|
18 mm/h, 2014 |
|
| Minimum Dew Point |
-0.4 °C |
23:42 |
0.1 °C |
8.8 °C, 2021 |
-5.1 °C, 2012 |
| Maximum Dew Point |
9.0 °C |
05:38 |
6.3 °C |
11.3 °C, 2021 |
0.1 °C, 2022 |
| Mean Dew Point |
4.3 °C |
|
2.8 °C |
10.2 °C, 2021 |
-2.2 °C, 2012 |
| Measure | Value | Time |
Month cumul. | Record High | Record Low |
| Night Minimum (21-09) |
* 8.5 °C * |
02:40 |
4.0 °C |
9.7 °C, 2021 |
-4.7 °C, 2012 |
| Day Maximum (09-21) |
* 8.6 °C * |
10:27 |
7.3 °C |
13.2 °C, 2015 |
0.8 °C, 2022 |
| Max 10m Temp Rise |
0.2 °C |
04:21 |
0.3 °C |
0.6 °C, 2013 |
0.2 °C, 2014 |
| Max 1hr Temp Rise |
0.7 °C |
04:21 |
1.1 °C |
2.2 °C, 2013 |
0.4 °C, 2018 |
| Max 1hr Hum Rise |
9% |
01:42 |
7% |
9%, 2014 |
0%, 2013 |
| Max 10m Temp Fall |
0.5 °C |
13:32 |
0.4 °C |
0.5 °C, 2014 |
0.1 °C, 2015 |
| Max 1hr Temp Fall |
1.4 °C |
14:22 |
1.0 °C |
1.5 °C, 2010 |
0.2 °C, 2015 |
| Max 1hr Hum Fall |
9% |
13:33 |
11% |
9%, 2014 |
1%, 2013 |
| Max 10m Wind Speed |
14.6 mph |
04:26 |
11.2 mph |
15.4 mph, 2011 |
5.5 mph, 2012 |
| Minimum Feels-like |
-0.7 °C |
22:15 |
-0.7 °C |
11.6 °C, 2021 |
-7.9 °C, 2017 |
| Maximum Feels-like |
10.9 °C |
05:32 |
7.8 °C |
14.8 °C, 2021 |
0.7 °C, 2022 |
| Mean Feels-like |
4.5 °C |
|
3.2 °C |
13.1 °C, 2021 |
-2.2 °C, 2017 |
| Air-frost Hrs |
0 hrs |
|
0.2 hrs |
15 hrs, 2022 |
0 hrs, 2009 |
| Measure | Value (anomaly) |
Month cumul. | Record High | Record Low |
| Temperature Range |
7.1 °C (+2.5) |
5.0 °C (+0.2) |
8.6 °C (+4.0), 2013 |
1.8 °C (-2.8), 2022 |
| Humidity Range |
20% |
23% |
28%, 2018 |
1%, 2013 |
| Pressure Range |
15 hPa |
9 hPa |
32 hPa, 2019 |
3 hPa, 2010 |
| Measure | Value [% of max] |
Month cumul. | Record High | Record Low |
| Sun Hours |
0 [0%] | 27 hrs (107%) [32%] |
6.3 [89%], 2017 |
0 [0%], 2014 |
| Wet Hours |
7
[Mean rain rate: 1.5 mm/h] | 23 hrs (94%) [7.8%] |
11, 2023 |
0, 2009 |
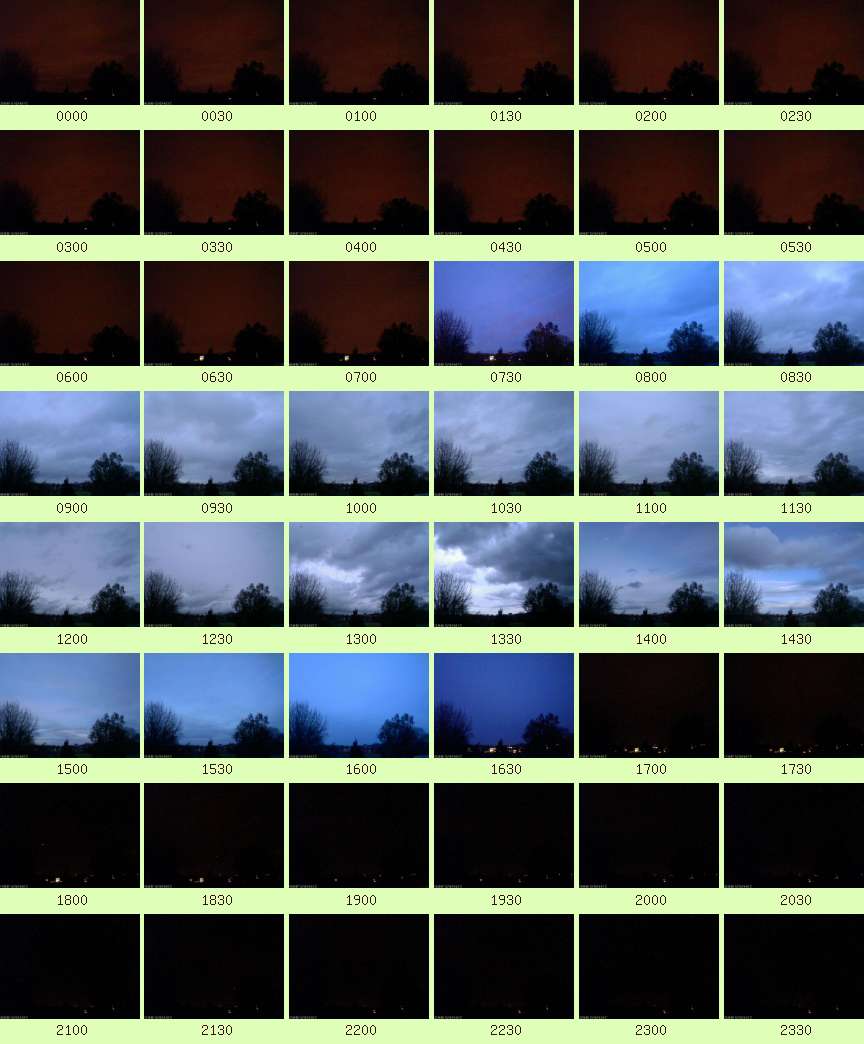
| Cloud Cover |
Overcast or Mostly Cloudy |
| Events |
None |
| Comments |
o.night Rain, 0930 Shower |
| Extra Comments |
|
| Issues |
None known |
| Observer Absent? |
No |
| Pond Temperature (Heath) |
0.0 °C |


 Large resolution version
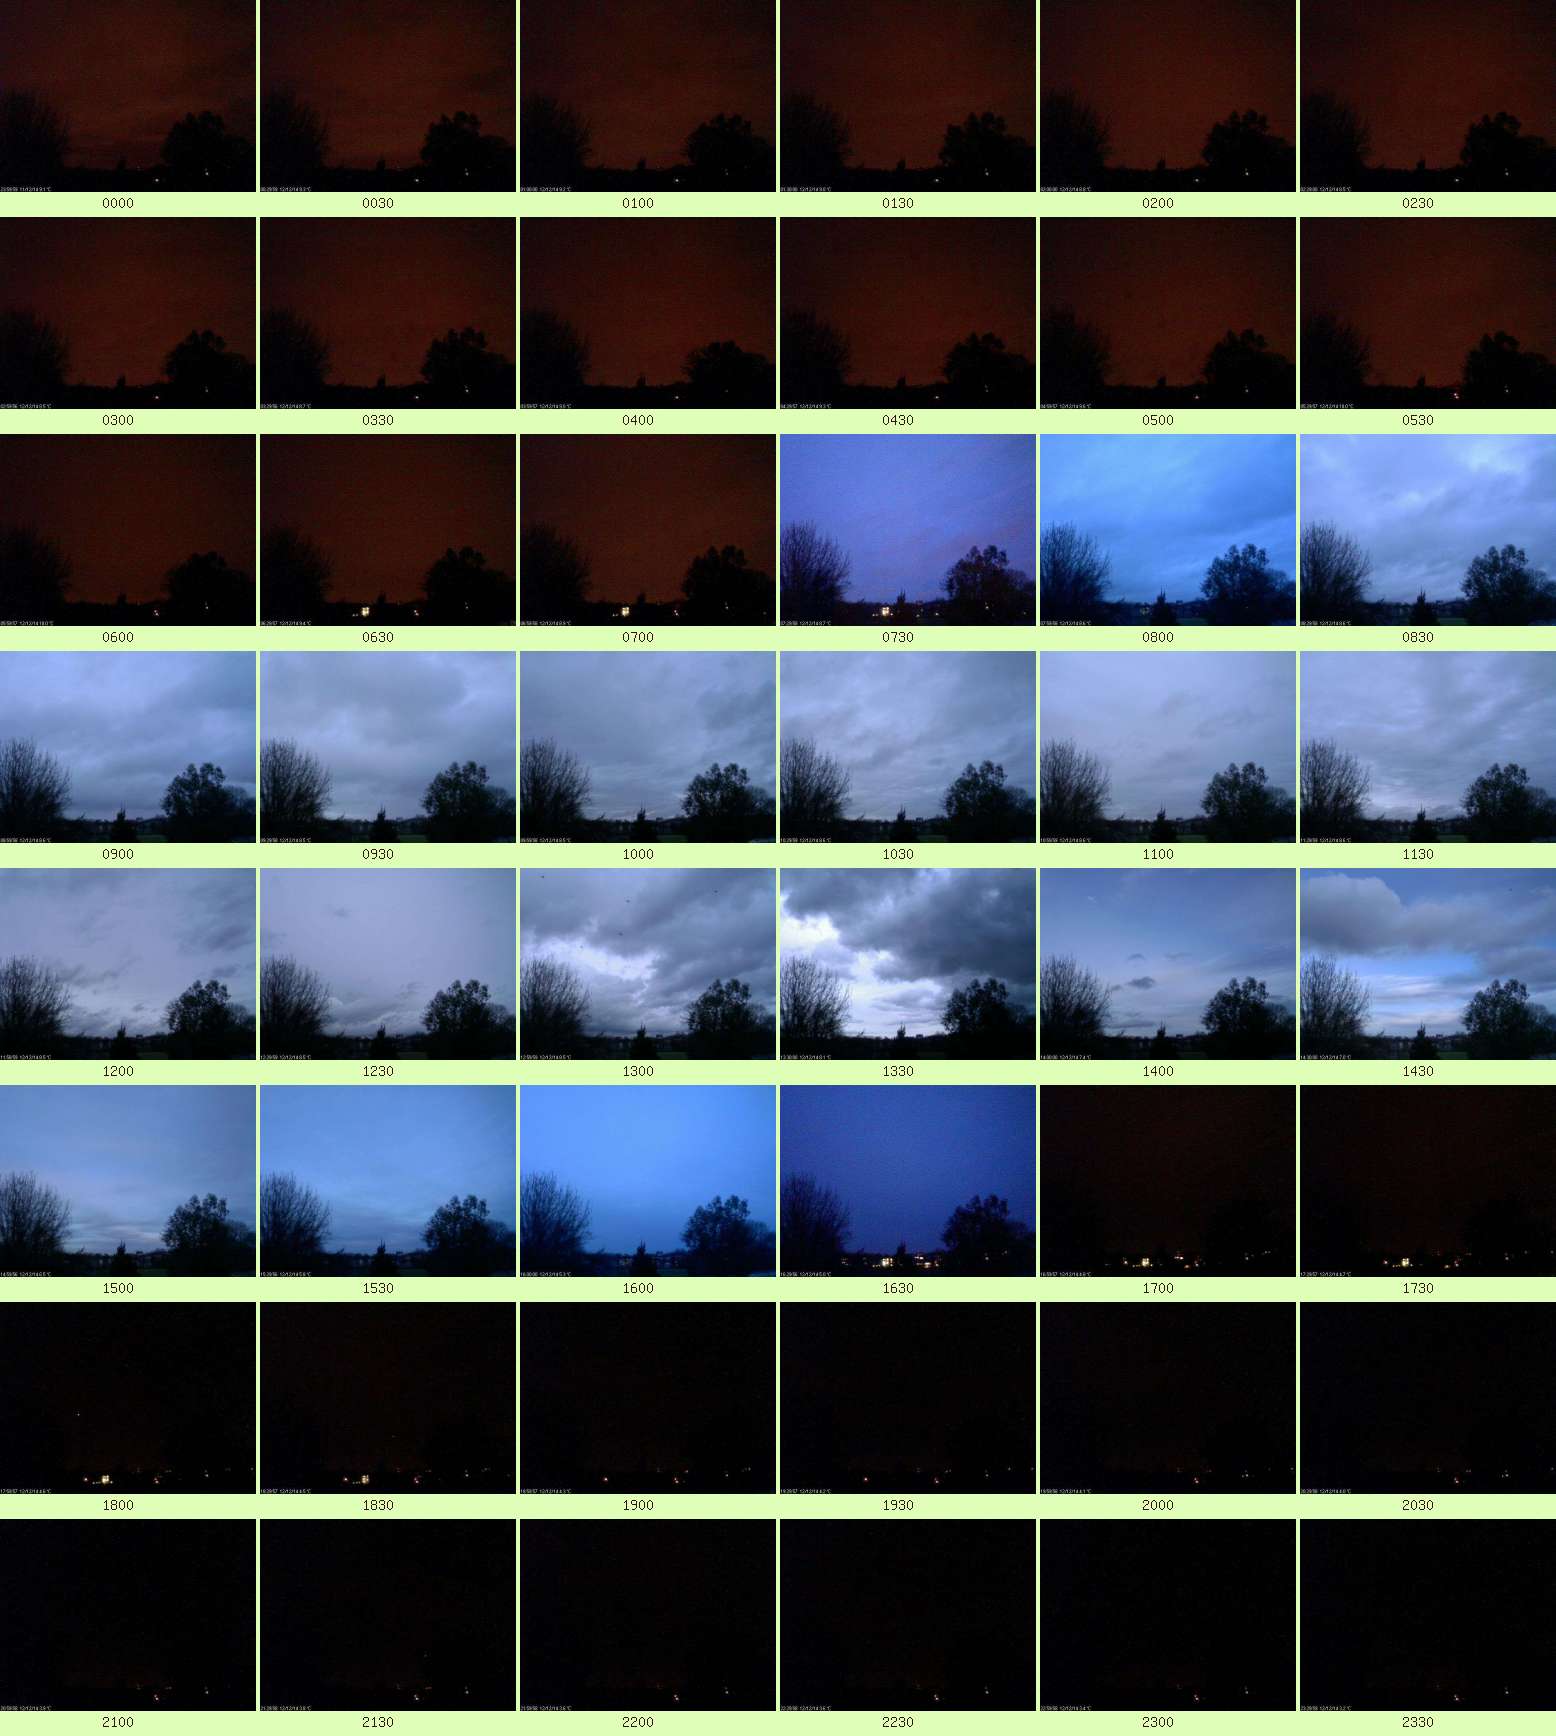