| Measure | Value (anomaly) | Time |
Month cumul. | Record High | Record Low |
| Minimum Temperature |
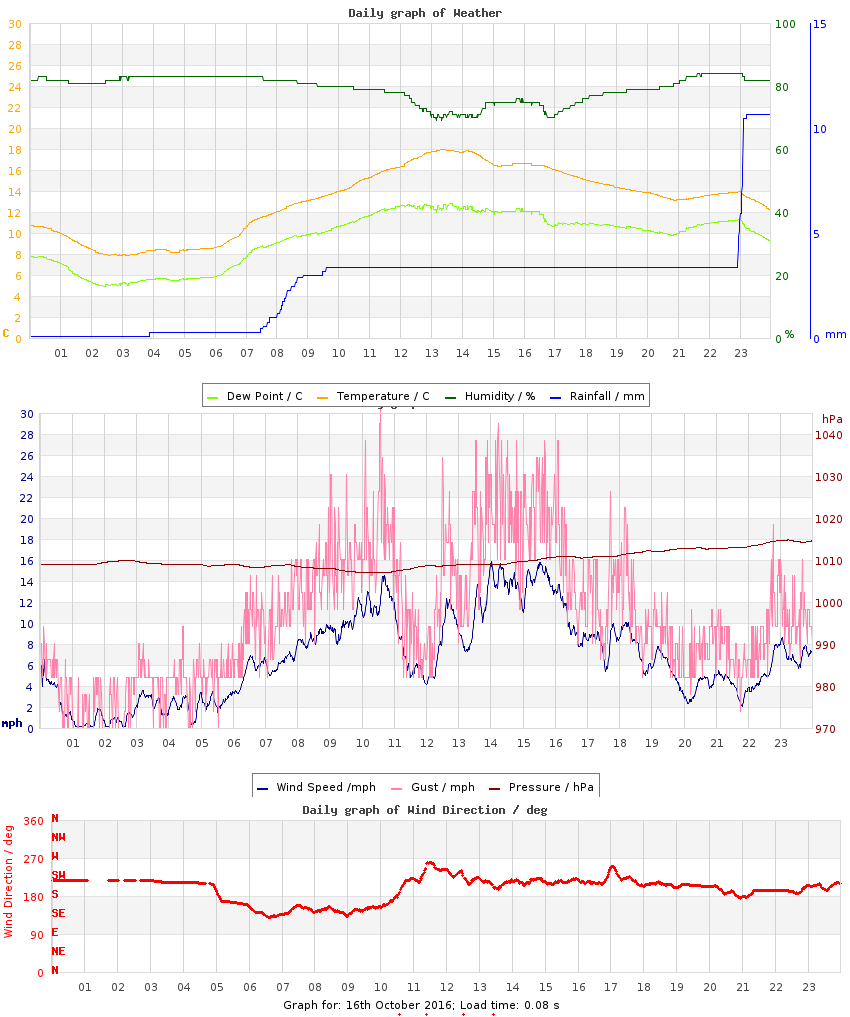
7.9 °C (-0.7) |
02:53 |
8.6 °C (-0.6) |
13.8 °C (+5.2), 2018 |
1.0 °C (-7.6), 2023 |
| Maximum Temperature |
18.0 °C (+3.3) |
13:22 |
15.5 °C (-0.0) |
22.1 °C (+7.4), 2017 |
11.8 °C (-2.9), 2023 |
| Mean Temperature |
13.1 °C (+1.3) |
|
11.9 °C (-0.3) |
16.4 °C, 2017 |
6.8 °C, 2023 |
| Minimum Humidity |
69% |
13:14 |
60% |
85%, 2013 |
47%, 2012 |
| Maximum Humidity |
84% |
22:20 |
82% |
98%, 2013 |
84%, 2016 |
| Mean Humidity |
79% |
|
74% |
95%, 2013 |
70%, 2012 |
| Minimum Pressure |
1008 hPa |
09:59 |
1017 hPa |
1031 hPa, 2009 |
995 hPa, 2012 |
| Maximum Pressure |
1015 hPa |
23:11 |
1023 hPa |
1033 hPa, 2009 |
1004 hPa, 2012 |
| Mean Pressure |
1011 hPa |
|
1020 hPa |
1032 hPa, 2009 |
1000 hPa, 2012 |
| Mean Wind Speed |
6.7 mph (+2.6) |
|
4.3 mph (+0.2) |
7.3 mph, 2012 |
0.8 mph, 2021 |
| Maximum Wind Speed |
20.2 mph |
14:14 |
15.0 mph |
22.5 mph, 2012 |
6.7 mph, 2011 |
| Maximum Gust |
30.6 mph |
10:35 |
24.2 mph |
31.1 mph, 2017 |
9.8 mph, 2011 |
| Mean Wind Direction |
SSW |
|
|
|
|
| Rainfall |
10.6 mm |
|
37.0 mm (110%) |
10.6 mm, 2016 |
|
| Maximum Hourly Rain |
7.3 mm |
23:13 |
|
7.3 mm, 2016 |
|
| Maximum 10-min Rain |
5.8 mm |
23:06 |
|
5.8 mm, 2016 |
|
| Maximum Rain Rate |
120 mm/h |
23:06 |
|
120 mm/h, 2016 |
|
| Minimum Dew Point |
4.9 °C |
02:24 |
4.8 °C |
11.2 °C, 2018 |
0.0 °C, 2023 |
| Maximum Dew Point |
12.8 °C |
13:38 |
9.7 °C |
16.4 °C, 2017 |
8.1 °C, 2023 |
| Mean Dew Point |
9.5 °C |
|
7.3 °C |
13.8 °C, 2018 |
4.2 °C, 2023 |
| Measure | Value | Time |
Month cumul. | Record High | Record Low |
| Night Minimum (21-09) |
7.9 °C |
02:53 |
8.8 °C |
13.2 °C, 2018 |
1.0 °C, 2023 |
| Day Maximum (09-21) |
18.0 °C |
13:22 |
15.5 °C |
22.1 °C, 2017 |
11.8 °C, 2023 |
| Max 10m Temp Rise |
0.7 °C |
06:55 |
0.6 °C |
1.0 °C, 2011 |
0.2 °C, 2015 |
| Max 1hr Temp Rise |
2.4 °C |
07:11 |
2.2 °C |
4.3 °C, 2011 |
0.7 °C, 2015 |
| Max 1hr Hum Rise |
6% |
17:54 |
6% |
11%, 2019 |
2%, 2013 |
| Max 10m Temp Fall |
0.5 °C |
23:10 |
0.4 °C |
0.5 °C, 2010 |
0.2 °C, 2015 |
| Max 1hr Temp Fall |
1.8 °C |
23:59 |
1.5 °C |
2.4 °C, 2019 |
0.5 °C, 2023 |
| Max 1hr Hum Fall |
8% |
13:00 |
9% |
18%, 2017 |
4%, 2015 |
| Max 10m Wind Speed |
15.9 mph |
14:02 |
11.2 mph |
15.9 mph, 2016 |
5.0 mph, 2011 |
| Minimum Feels-like |
5.6 °C |
03:12 |
6.9 °C |
15.9 °C, 2018 |
0.0 °C, 2009 |
| Maximum Feels-like |
20.6 °C |
13:24 |
16.3 °C |
26.6 °C, 2017 |
0.0 °C, 2009 |
| Mean Feels-like |
14.1 °C |
|
12.2 °C |
19.3 °C, 2017 |
0.0 °C, 2009 |
| Air-frost Hrs |
0 hrs |
|
0 hrs |
0 hrs, 2009 |
0 hrs, 2009 |
| Measure | Value (anomaly) |
Month cumul. | Record High | Record Low |
| Temperature Range |
10.1 °C (+3.9) |
6.9 °C (+0.5) |
12.6 °C (+6.5), 2011 |
2.5 °C (-3.7), 2015 |
| Humidity Range |
15% |
22% |
48%, 2012 |
10%, 2021 |
| Pressure Range |
7 hPa |
6 hPa |
10 hPa, 2010 |
1 hPa, 2015 |
| Measure | Value [% of max] |
Month cumul. | Record High | Record Low |
| Sun Hours |
3 [32%] | 69 hrs (109%) [44%] |
7 [74%], 2012 |
0 [0%], 2015 |
| Wet Hours |
4
[Mean rain rate: 2.6 mm/h] | 21 hrs (83%) [5.5%] |
4, 2013 |
0, 2011 |
| Cloud Cover |
unknown |
| Events |
Light Thunderstorm |
| Comments |
am Rain, 23 Torrential Shower with Thunderstorm |
| Extra Comments |
|
| Issues |
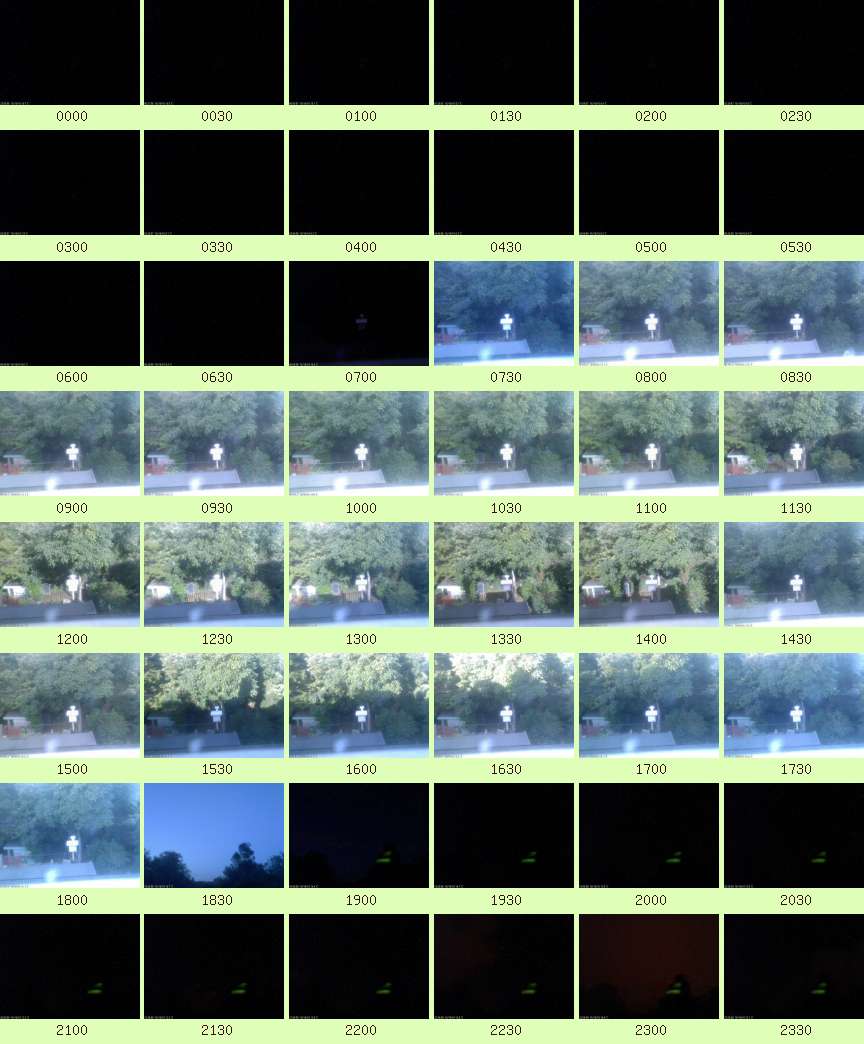
webcam not showing sky |
| Observer Absent? |
Yes - observations may be unreliable |
| Pond Temperature (Heath) |
0.0 °C |


 Large resolution version
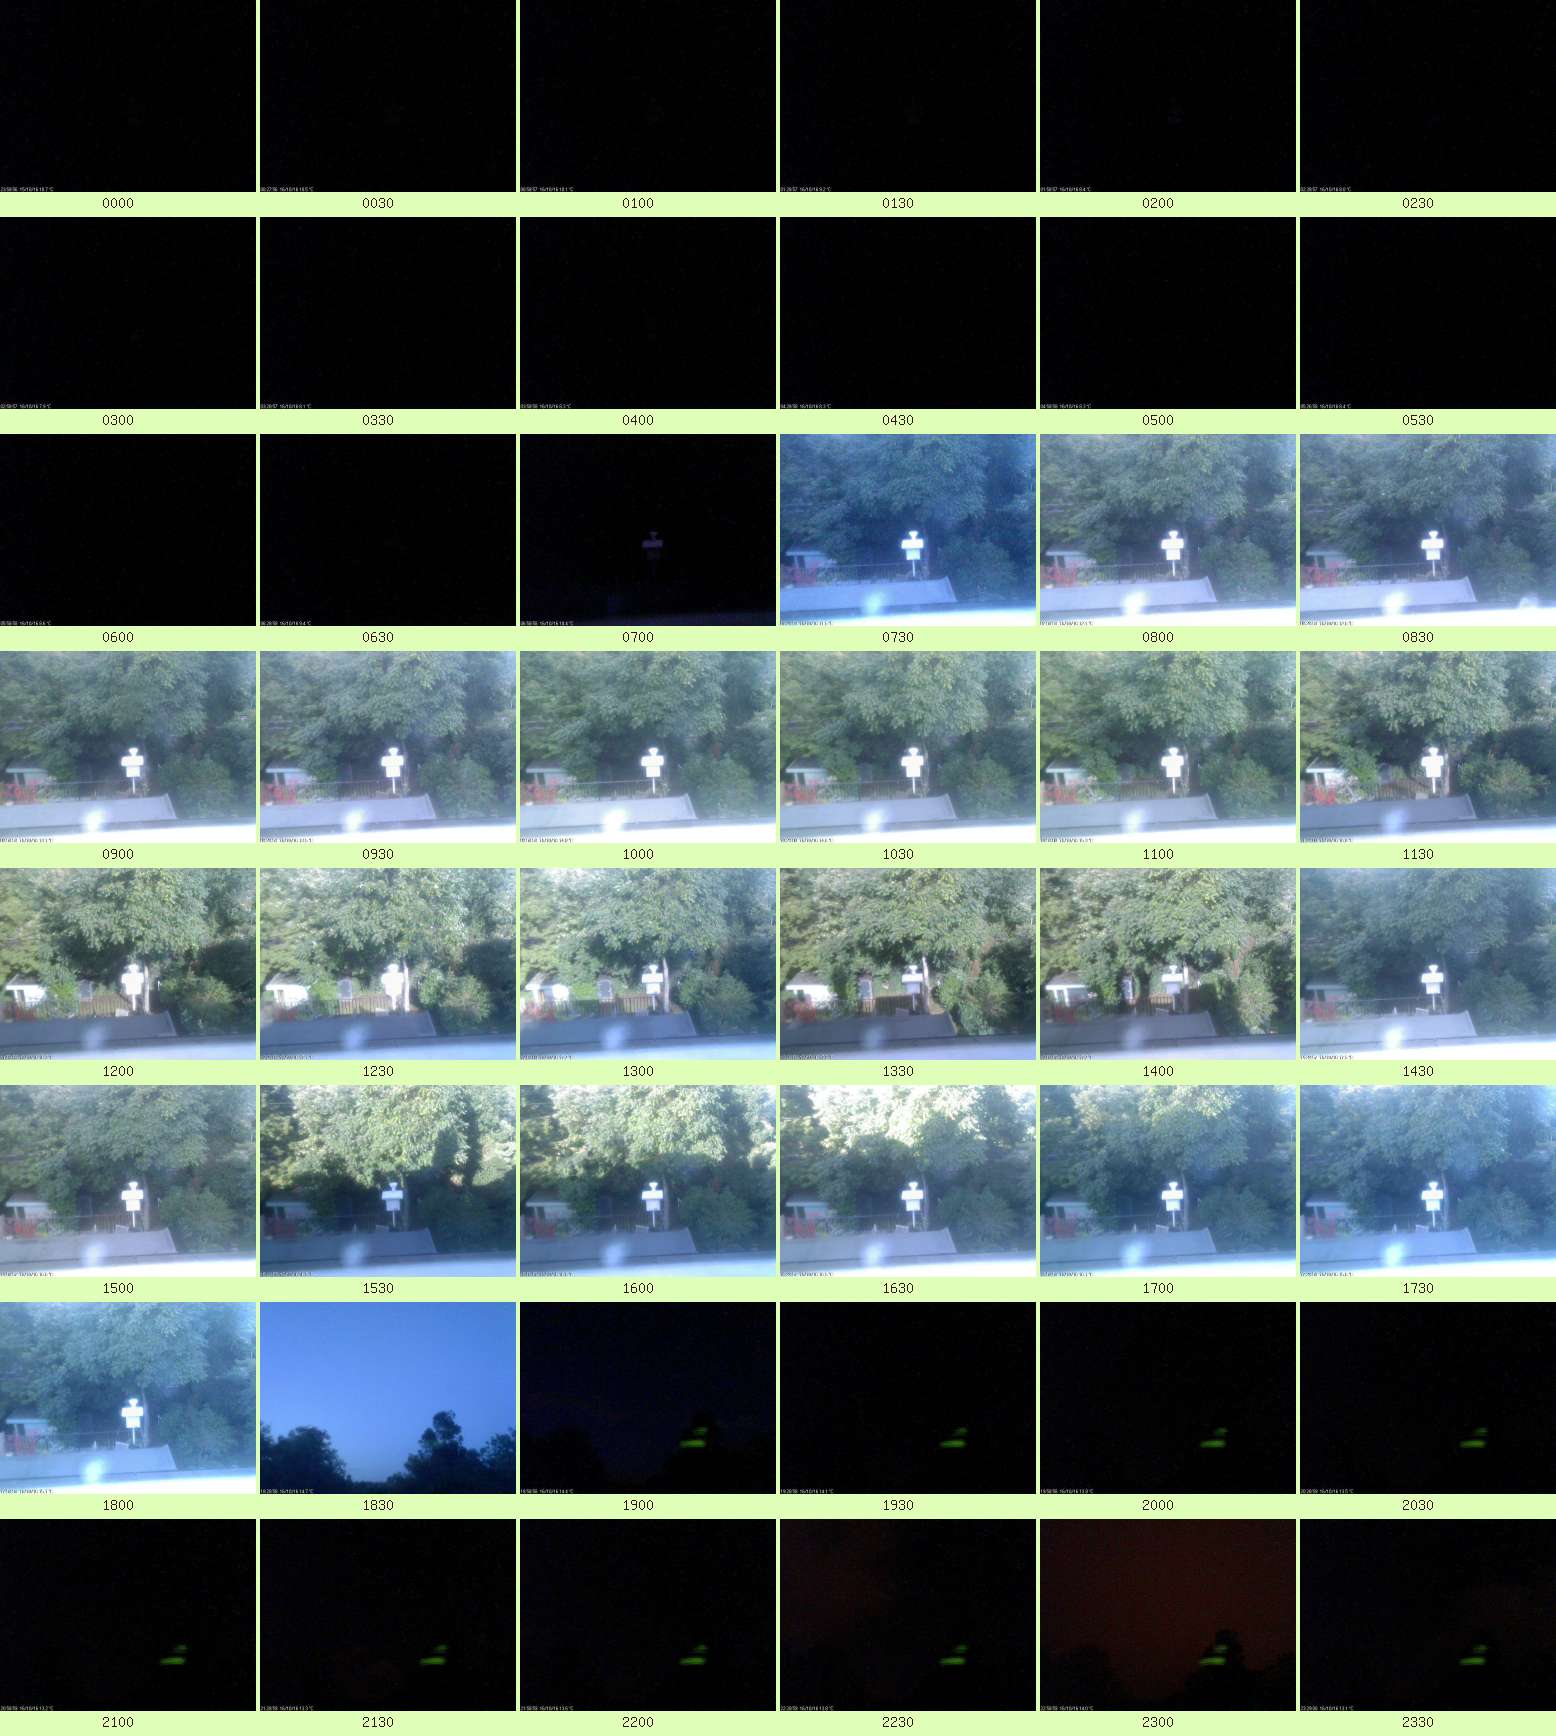