| Measure | Value (anomaly) | Time |
Month cumul. | Record High | Record Low |
| Minimum Temperature |
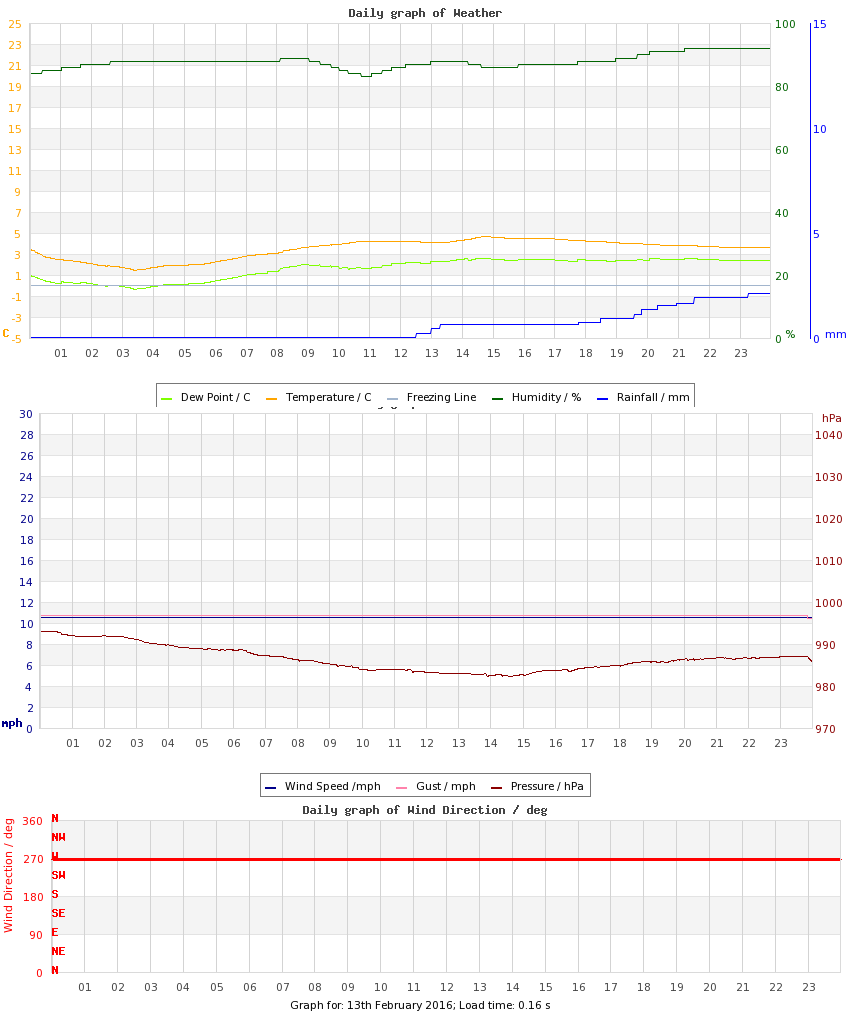
1.4 °C (-1.4) |
03:24 |
4.5 °C (+1.6) |
7.1 °C (+4.3), 2022 |
-3.9 °C (-6.7), 2021 |
| Maximum Temperature |
4.7 °C (-3.3) |
14:46 |
9.2 °C (+1.3) |
11.7 °C (+3.7), 2023 |
1.5 °C (-6.5), 2021 |
| Mean Temperature |
3.5 °C (-2.4) |
|
7.2 °C (+1.5) |
8.2 °C, 2022 |
-1.1 °C, 2021 |
| Minimum Humidity |
83% |
10:53 |
62% |
83%, 2016 |
51%, 2014 |
| Maximum Humidity |
92% |
22:35 |
86% |
98%, 2009 |
75%, 2021 |
| Mean Humidity |
88% |
|
76% |
92%, 2012 |
64%, 2021 |
| Minimum Pressure |
983 hPa |
14:06 |
998 hPa |
1033 hPa, 2023 |
983 hPa, 2016 |
| Maximum Pressure |
993 hPa |
00:15 |
1008 hPa |
1037 hPa, 2023 |
993 hPa, 2016 |
| Mean Pressure |
986 hPa |
|
1002 hPa |
1035 hPa, 2023 |
986 hPa, 2016 |
| Mean Wind Speed |
4.1 mph (-1.0) |
|
7.6 mph (+2.5) |
10.9 mph, 2022 |
2.8 mph, 2023 |
| Maximum Wind Speed |
12.0 mph |
00:00 |
18.1 mph |
20.9 mph, 2020 |
8.9 mph, 2023 |
| Maximum Gust |
17.0 mph |
00:00 |
26.0 mph |
33.4 mph, 2018 |
12.7 mph, 2023 |
| Mean Wind Direction |
ENE |
|
|
|
|
| Rainfall |
2.1 mm |
|
22.3 mm (111%) |
9.4 mm, 2022 |
|
| Maximum Hourly Rain |
0.6 mm |
13:17 |
|
2.9 mm, 2020 |
|
| Maximum 10-min Rain |
0.3 mm |
21:31 |
|
0.9 mm, 2020 |
|
| Maximum Rain Rate |
0.7 mm/h |
19:49 |
|
18 mm/h, 2020 |
|
| Minimum Dew Point |
-0.4 °C |
03:24 |
0.2 °C |
4.4 °C, 2022 |
-8.7 °C, 2021 |
| Maximum Dew Point |
2.6 °C |
17:51 |
5.6 °C |
10.4 °C, 2024 |
-5.1 °C, 2021 |
| Mean Dew Point |
1.6 °C |
|
3.1 °C |
6.7 °C, 2024 |
-7.2 °C, 2021 |
| Measure | Value | Time |
Month cumul. | Record High | Record Low |
| Night Minimum (21-09) |
1.4 °C |
03:24 |
5.5 °C |
6.8 °C, 2019 |
-3.9 °C, 2021 |
| Day Maximum (09-21) |
4.7 °C |
14:46 |
9.2 °C |
11.7 °C, 2023 |
1.1 °C, 2021 |
| Max 10m Temp Rise |
0.2 °C |
08:47 |
0.3 °C |
0.6 °C, 2023 |
0.1 °C, 2011 |
| Max 1hr Temp Rise |
0.6 °C |
06:34 |
1.1 °C |
1.9 °C, 2023 |
0.5 °C, 2011 |
| Max 1hr Hum Rise |
3% |
11:44 |
7% |
9%, 2012 |
3%, 2011 |
| Max 10m Temp Fall |
0.3 °C |
00:24 |
0.4 °C |
0.5 °C, 2018 |
0.1 °C, 2013 |
| Max 1hr Temp Fall |
0.9 °C |
01:01 |
1.2 °C |
1.9 °C, 2023 |
0.3 °C, 2013 |
| Max 1hr Hum Fall |
4% |
10:01 |
8% |
15%, 2012 |
3%, 2011 |
| Max 10m Wind Speed |
10.5 mph |
00:10 |
13.8 mph |
15.9 mph, 2020 |
6.4 mph, 2023 |
| Minimum Feels-like |
-3.1 °C |
03:22 |
0.2 °C |
2.6 °C, 2019 |
-12.5 °C, 2021 |
| Maximum Feels-like |
1.1 °C |
14:37 |
8.0 °C |
13.0 °C, 2024 |
-1.5 °C, 2021 |
| Mean Feels-like |
-0.5 °C |
|
4.8 °C |
6.6 °C, 2023 |
-6.6 °C, 2021 |
| Air-frost Hrs |
0 hrs |
|
0 hrs |
14 hrs, 2021 |
0 hrs, 2009 |
| Measure | Value (anomaly) |
Month cumul. | Record High | Record Low |
| Temperature Range |
3.3 °C (-1.9) |
4.7 °C (-0.3) |
9.4 °C (+4.2), 2023 |
2.7 °C (-2.5), 2022 |
| Humidity Range |
9% |
24% |
35%, 2009 |
9%, 2016 |
| Pressure Range |
10 hPa |
10 hPa |
23 hPa, 2022 |
2 hPa, 2019 |
| Measure | Value [% of max] |
Month cumul. | Record High | Record Low |
| Sun Hours |
0 [0%] | 24 hrs (68%) [21%] |
8.8 [100%], 2023 |
0 [0%], 2011 |
| Wet Hours |
12
[Mean rain rate: 0.2 mm/h] | 28 hrs (121%) [9%] |
12, 2016 |
, 2009 |
| Cloud Cover |
Overcast |
| Events |
None |
| Comments |
Rain/Drizzle spells throughout |
| Extra Comments |
|
| Issues |
No wind data all day; corrected using Harpenden |
| Observer Absent? |
Yes - observations may be unreliable |
| Pond Temperature (Heath) |
0.0 °C |


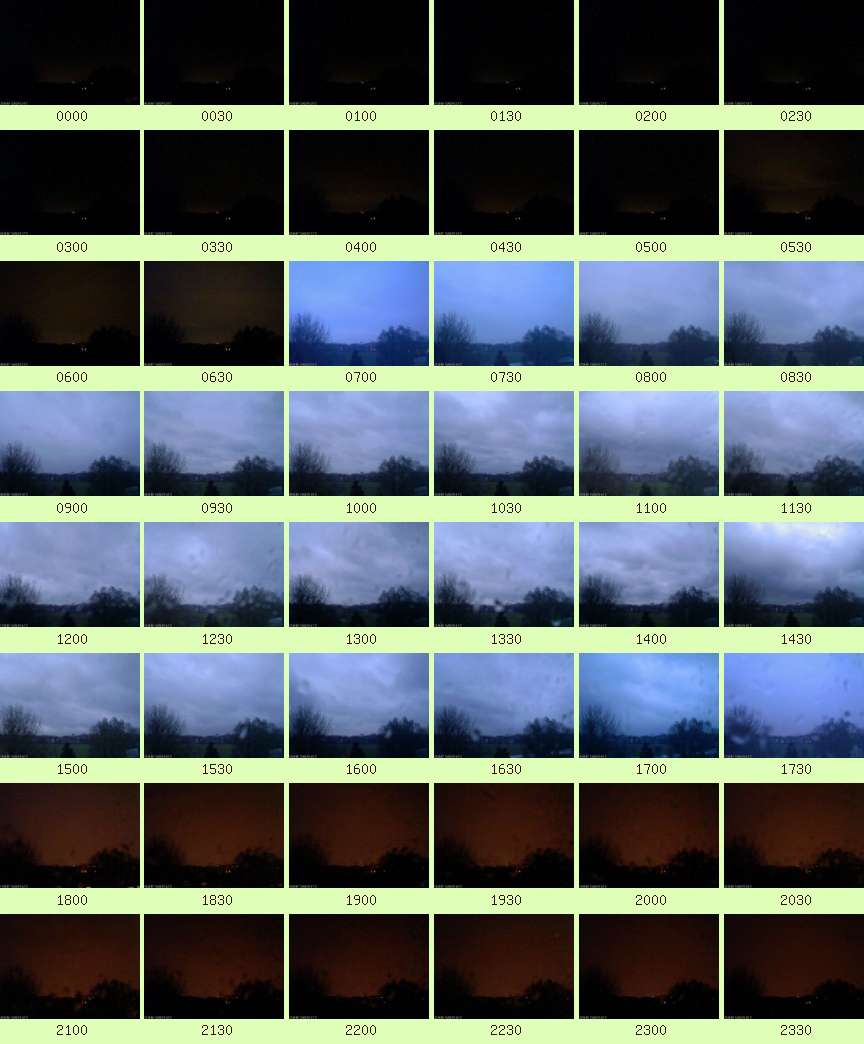 Large resolution version