| Measure | Value (anomaly) | Time |
Month cumul. | Record High | Record Low |
| Minimum Temperature |
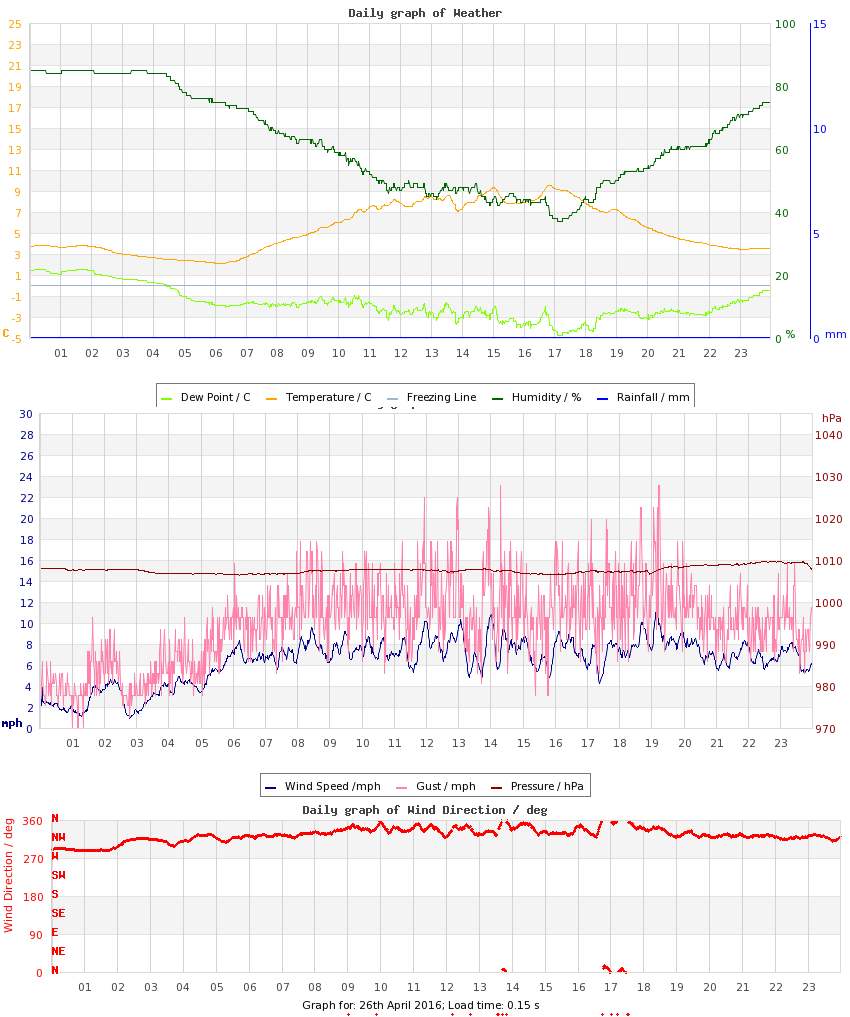
2.1 °C (-4.6) |
06:09 |
5.4 °C (-0.6) |
9.3 °C (+2.6), 2012 |
2.1 °C (-4.6), 2016 |
| Maximum Temperature |
9.5 °C (-6.1) |
16:49 |
13.1 °C (-1.2) |
20.8 °C (+5.2), 2020 |
9.5 °C (-6.1), 2016 |
| Mean Temperature |
5.3 °C (-5.3) |
|
9.2 °C (-0.9) |
13.1 °C, 2020 |
5.3 °C, 2017 |
| Minimum Humidity |
37% |
17:10 |
46% |
65%, 2015 |
32%, 2009 |
| Maximum Humidity |
85% |
01:53 |
86% |
96%, 2014 |
78%, 2017 |
| Mean Humidity |
62% |
|
67% |
82%, 2015 |
59%, 2009 |
| Minimum Pressure |
1007 hPa |
12:03 |
1009 hPa |
1024 hPa, 2011 |
984 hPa, 2012 |
| Maximum Pressure |
1010 hPa |
22:40 |
1015 hPa |
1028 hPa, 2021 |
1003 hPa, 2012 |
| Mean Pressure |
1008 hPa |
|
1011 hPa |
1025 hPa, 2010 |
994 hPa, 2012 |
| Mean Wind Speed |
6.4 mph (+1.5) |
|
3.9 mph (-1.0) |
10.7 mph, 2012 |
2.5 mph, 2020 |
| Maximum Wind Speed |
16.2 mph |
19:03 |
11.7 mph |
25.1 mph, 2012 |
8.6 mph, 2020 |
| Maximum Gust |
23.1 mph |
14:18 |
18.1 mph |
33.4 mph, 2012 |
13.5 mph, 2015 |
| Mean Wind Direction |
NNW |
|
|
|
|
| Rainfall / Snow-melt approx. |
trace |
|
47.1 mm (129%) |
3.9, 2013 |
|
| Maximum Hourly Rain |
n/a |
|
|
2.6, 2015 |
|
| Maximum 10-min Rain |
n/a |
|
|
0.8, 2012 |
|
| Maximum Rain Rate |
n/a |
|
|
24, 2017 |
|
| Minimum Dew Point |
-4.8 °C |
17:10 |
0.2 °C |
6.4 °C, 2010 |
-4.8 °C, 2016 |
| Maximum Dew Point |
1.5 °C |
00:59 |
6.4 °C |
11.7 °C, 2010 |
1.5 °C, 2016 |
| Mean Dew Point |
-1.7 °C |
|
3.1 °C |
8.2 °C, 2010 |
-1.7 °C, 2016 |
| Measure | Value | Time |
Month cumul. | Record High | Record Low |
| Night Minimum (21-09) |
2.1 °C |
06:09 |
5.8 °C |
9.3 °C, 2012 |
2.1 °C, 2016 |
| Day Maximum (09-21) |
9.5 °C |
16:49 |
13.1 °C |
20.8 °C, 2020 |
9.5 °C, 2016 |
| Max 10m Temp Rise |
0.8 °C |
16:41 |
0.6 °C |
0.9 °C, 2017 |
0.3 °C, 2015 |
| Max 1hr Temp Rise |
2.1 °C |
14:59 |
2.2 °C |
4.7 °C, 2020 |
1.1 °C, 2015 |
| Max 1hr Hum Rise |
10% |
18:21 |
10% |
26%, 2018 |
5%, 2011 |
| Max 10m Temp Fall |
1.2 °C |
13:47 |
0.6 °C |
1.4 °C, 2017 |
0.3 °C, 2023 |
| Max 1hr Temp Fall |
1.9 °C |
18:27 |
1.8 °C |
2.8 °C, 2019 |
0.8 °C, 2023 |
| Max 1hr Hum Fall |
9% |
10:47 |
14% |
28%, 2018 |
7%, 2017 |
| Max 10m Wind Speed |
11.2 mph |
19:10 |
8.6 mph |
16.2 mph, 2012 |
6.1 mph, 2011 |
| Minimum Feels-like |
-3.2 °C |
06:03 |
2.9 °C |
6.1 °C, 2010 |
-3.2 °C, 2016 |
| Maximum Feels-like |
8.0 °C |
16:46 |
13.1 °C |
20.8 °C, 2020 |
8.0 °C, 2016 |
| Mean Feels-like |
2.3 °C |
|
8.2 °C |
13.1 °C, 2020 |
2.3 °C, 2016 |
| Air-frost Hrs |
0 hrs |
|
0 hrs |
0 hrs, 2009 |
0 hrs, 2009 |
| Measure | Value (anomaly) |
Month cumul. | Record High | Record Low |
| Temperature Range |
7.4 °C (-1.5) |
7.8 °C (-0.6) |
17.5 °C (+8.6), 2020 |
5.1 °C (-3.8), 2012 |
| Humidity Range |
48% |
40% |
61%, 2020 |
19%, 2011 |
| Pressure Range |
3 hPa |
5 hPa |
19 hPa, 2012 |
2 hPa, 2011 |
| Measure | Value [% of max] |
Month cumul. | Record High | Record Low |
| Sun Hours |
8 [61%] | 117 hrs (84%) [36%] |
13 [99%], 2020 |
0 [0%], 2015 |
| Wet Hours |
0.3 | 56 hrs (140%) [8.9%] |
3.5, 2013 |
0, 2009 |
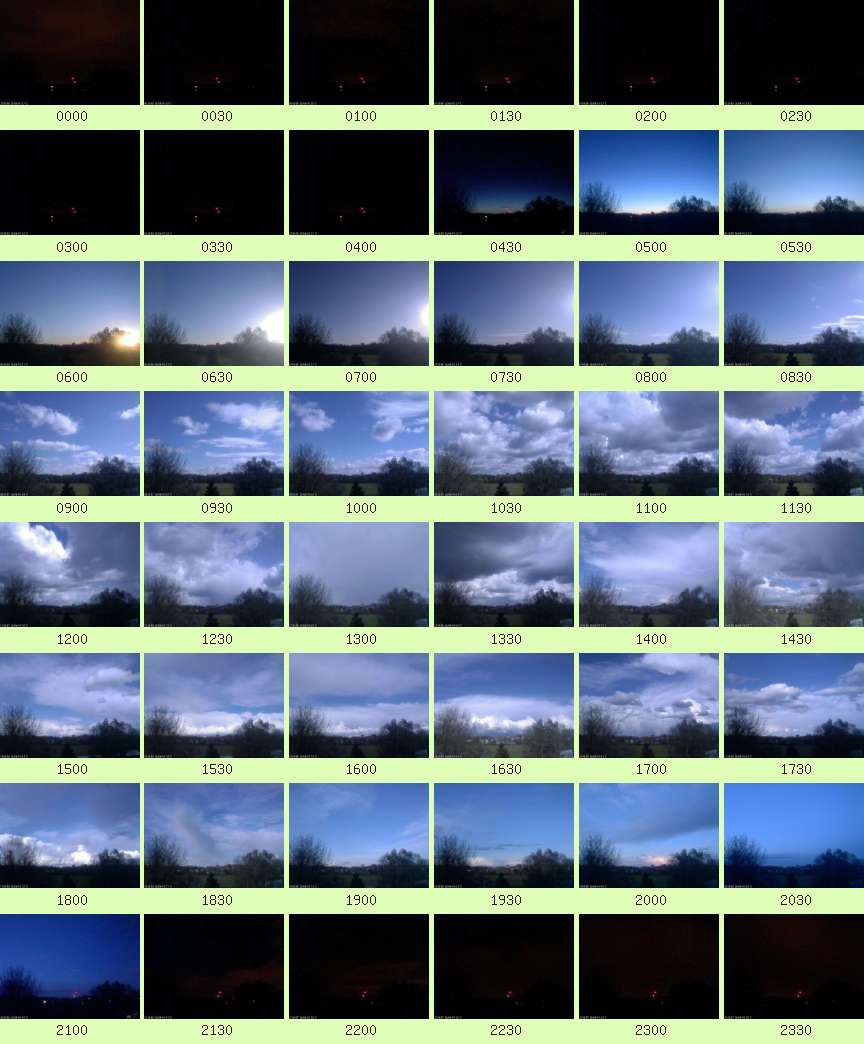
| Cloud Cover |
am: Sunny transitioned to Mostly Sunny
pm: Partly Cloudy |
| Events |
Snowfall: trace amount |
| Comments |
Poss pm Snow/icy Showers (w possible Thunder) |
| Extra Comments |
|
| Issues |
Wind data from Harpenden |
| Observer Absent? |
Yes - observations may be unreliable |
| Pond Temperature (Heath) |
0.0 °C |


 Large resolution version