| Measure | Value (anomaly) | Time |
Month cumul. | Record High | Record Low |
| Minimum Temperature |
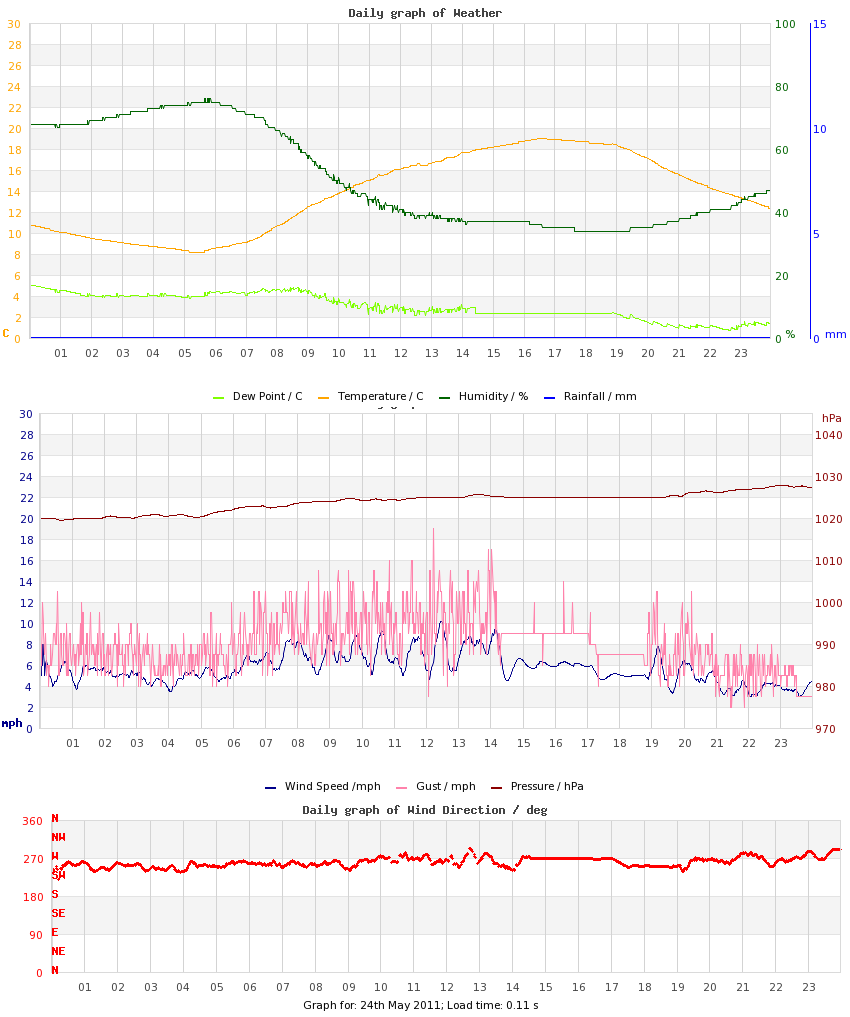
8.2 °C (-1.8) |
05:25 |
9.4 °C (+0.7) |
14.4 °C (+4.4), 2010 |
5.4 °C (-4.6), 2013 |
| Maximum Temperature |
19.0 °C (+0.4) |
16:35 |
18.7 °C (+1.3) |
31.9 °C (+13.3), 2026 |
8.9 °C (-9.7), 2013 |
| Mean Temperature |
13.8 °C (-0.7) |
|
14.3 °C (+1.0) |
23.2 °C, 2026 |
6.8 °C, 2013 |
| Minimum Humidity |
34% |
18:30 |
40% |
73%, 2013 |
32%, 2010 |
| Maximum Humidity |
76% |
05:45 |
79% |
94%, 2018 |
69%, 2010 |
| Mean Humidity |
51% |
|
58% |
83%, 2021 |
51%, 2011 |
| Minimum Pressure |
1020 hPa |
00:34 |
1016 hPa |
1030 hPa, 2026 |
1002 hPa, 2022 |
| Maximum Pressure |
1029 hPa |
23:03 |
1021 hPa |
1034 hPa, 2020 |
1010 hPa, 2021 |
| Mean Pressure |
1024 hPa |
|
1018 hPa |
1031 hPa, 2026 |
1004 hPa, 2021 |
| Mean Wind Speed |
6.6 mph (+1.9) |
|
6.0 mph (+1.3) |
7.3 mph, 2025 |
1.2 mph, 2017 |
| Maximum Wind Speed |
15.0 mph |
|
14.5 mph |
18.9 mph, 2022 |
7.7 mph, 2017 |
| Maximum Gust |
21.9 mph |
12:13 |
21.2 mph |
26.6 mph, 2013 |
10.5 mph, 2017 |
| Mean Wind Direction |
W |
|
|
|
|
| Rainfall |
0.0 mm |
|
8.3 mm (23%) |
9.3 mm, 2013 |
|
| Maximum Hourly Rain |
n/a |
|
|
5.2, 2025 |
|
| Maximum 10-min Rain |
n/a |
|
|
2, 2019 |
|
| Maximum Rain Rate |
n/a |
|
|
26, 2019 |
|
| Minimum Dew Point |
0.7 °C |
22:40 |
2.8 °C |
12.6 °C, 2012 |
0.7 °C, 2011 |
| Maximum Dew Point |
5.1 °C |
00:02 |
8.8 °C |
17.6 °C, 2012 |
5.1 °C, 2011 |
| Mean Dew Point |
3.1 °C |
|
5.8 °C |
15.5 °C, 2012 |
3.1 °C, 2011 |
| Measure | Value | Time |
Month cumul. | Record High | Record Low |
| Night Minimum (21-09) |
8.2 °C |
05:25 |
9.6 °C |
15.2 °C, 2010 |
5.4 °C, 2013 |
| Day Maximum (09-21) |
19.0 °C |
16:30 |
18.7 °C |
31.9 °C, 2026 |
8.9 °C, 2013 |
| Max 10m Temp Rise |
0.5 °C |
11:17 |
0.7 °C |
0.9 °C, 2009 |
0.4 °C, 2010 |
| Max 1hr Temp Rise |
1.9 °C |
08:55 |
2.9 °C |
3.9 °C, 2009 |
1.5 °C, 2025 |
| Max 1hr Hum Rise |
5% |
23:27 |
8% |
20%, 2019 |
5%, 2009 |
| Max 10m Temp Fall |
0.9 °C |
20:16 |
0.5 °C |
2.3 °C, 2022 |
0.3 °C, 2025 |
| Max 1hr Temp Fall |
4.0 °C |
20:25 |
1.6 °C |
4.0 °C, 2010 |
1.2 °C, 2025 |
| Max 1hr Hum Fall |
9% |
09:13 |
10% |
22%, 2016 |
6%, 2024 |
| Max 10m Wind Speed |
10.1 mph |
12:28 |
10.1 mph |
13.5 mph, 2021 |
5.1 mph, 2017 |
| Minimum Feels-like |
5.4 °C |
05:19 |
8.5 °C |
16.9 °C, 2012 |
1.5 °C, 2013 |
| Maximum Feels-like |
19.0 °C |
16:26 |
19.1 °C |
36.6 °C, 2026 |
8.2 °C, 2013 |
| Mean Feels-like |
13.3 °C |
|
14.5 °C |
27.0 °C, 2026 |
4.4 °C, 2013 |
| Air-frost Hrs |
0 hrs |
|
0 hrs |
0 hrs, 2009 |
0 hrs, 2009 |
| Measure | Value (anomaly) |
Month cumul. | Record High | Record Low |
| Temperature Range |
10.8 °C (+2.2) |
9.3 °C (+0.5) |
17.5 °C (+8.9), 2026 |
3.5 °C (-5.1), 2013 |
| Humidity Range |
42% |
38% |
53%, 2026 |
18%, 2013 |
| Pressure Range |
9 hPa |
5 hPa |
14 hPa, 2013 |
2 hPa, 2012 |
| Measure | Value [% of max] |
Month cumul. | Record High | Record Low |
| Sun Hours |
13 [90%] | 181 hrs (125%) [54%] |
14.5 [100%], 2009 |
0.1 [1%], 2013 |
| Wet Hours |
0 | 6.3 hrs (20%) [1.1%] |
8, 2013 |
0, 2009 |
| Cloud Cover |
Sunny or Mostly Sunny |
| Events |
None |
| Comments |
- |
| Extra Comments |
|
| Issues |
Data loss (1420-1850) - Tmax, Hmin, Sun and cloud cover are estimates |
| Observer Absent? |
Yes - observations may be unreliable |
| Pond Temperature @ Hampstead Heath |
0.0 °C |