| Measure | Value (anomaly) | Time |
Month cumul. | Record High | Record Low |
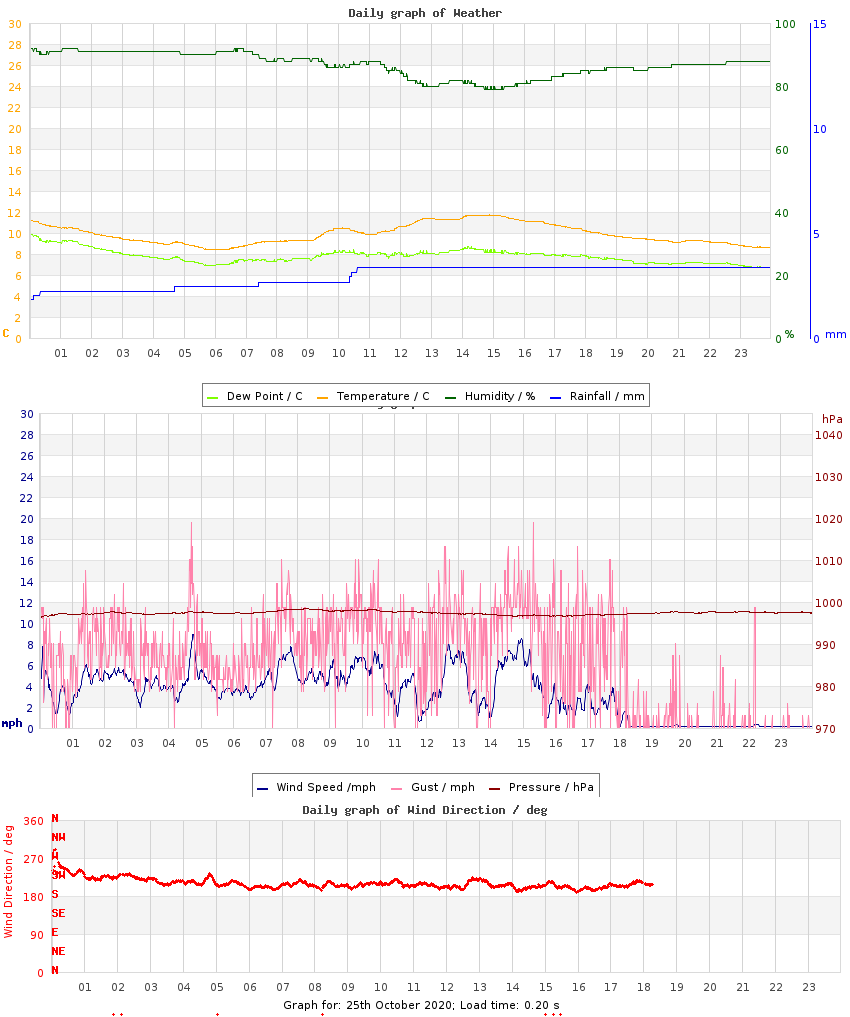
| Minimum Temperature |
8.4 °C (+0.8) |
06:03 |
8.7 °C (-0.0) |
13.0 °C (+5.3), 2013 |
1.4 °C (-6.2), 2010 |
| Maximum Temperature |
11.8 °C (-1.7) |
14:53 |
14.1 °C (-0.9) |
18.3 °C (+4.8), 2013 |
9.4 °C (-4.1), 2010 |
| Mean Temperature |
9.9 °C (-0.5) |
|
11.4 °C (-0.5) |
15.5 °C, 2013 |
5.0 °C, 2010 |
| Minimum Humidity |
79% |
15:07 |
74% |
92%, 2024 |
56%, 2010 |
| Maximum Humidity |
92% |
01:18 |
94% |
98%, 2012 |
84%, 2016 |
| Mean Humidity |
87% |
|
87% |
94%, 2024 |
76%, 2010 |
| Minimum Pressure |
996 hPa |
01:01 |
1006 hPa |
1024 hPa, 2010 |
992 hPa, 2011 |
| Maximum Pressure |
998 hPa |
08:12 |
1013 hPa |
1030 hPa, 2010 |
998 hPa, 2020 |
| Mean Pressure |
997 hPa |
|
1009 hPa |
1027 hPa, 2010 |
996 hPa, 2011 |
| Mean Wind Speed |
3.2 mph (-0.9) |
|
3.6 mph (-0.5) |
7.6 mph, 2009 |
0.4 mph, 2016 |
| Maximum Wind Speed |
12.1 mph |
14:51 |
13.3 mph |
22.6 mph, 2019 |
5.3 mph, 2016 |
| Maximum Gust |
19.6 mph |
04:42 |
21.3 mph |
36.9 mph, 2019 |
8.5 mph, 2015 |
| Mean Wind Direction |
SSW |
|
|
|
|
| Rainfall |
2.1 mm |
|
150.0 mm (286%) |
2.1 mm, 2020 |
|
| Maximum Hourly Rain |
0.7 mm |
01:01 |
|
1.7 mm, 2011 |
|
| Maximum 10-min Rain |
0.5 mm |
01:10 |
|
1.4 mm, 2011 |
|
| Maximum Rain Rate |
18 mm/h |
01:02 |
|
20 mm/h, 2011 |
|
| Minimum Dew Point |
6.7 °C |
23:42 |
6.8 °C |
11.6 °C, 2013 |
-0.8 °C, 2010 |
| Maximum Dew Point |
9.9 °C |
01:02 |
11.1 °C |
16.4 °C, 2013 |
4.0 °C, 2010 |
| Mean Dew Point |
7.8 °C |
|
9.1 °C |
13.1 °C, 2013 |
0.9 °C, 2010 |
| Measure | Value | Time |
Month cumul. | Record High | Record Low |
| Night Minimum (21-09) |
8.4 °C |
06:03 |
9.2 °C |
14.3 °C, 2017 |
2.2 °C, 2010 |
| Day Maximum (09-21) |
11.8 °C |
14:53 |
14.1 °C |
18.3 °C, 2013 |
9.4 °C, 2010 |
| Max 10m Temp Rise |
0.4 °C |
09:32 |
0.4 °C |
0.8 °C, 2009 |
0.2 °C, 2012 |
| Max 1hr Temp Rise |
1.2 °C |
10:07 |
1.5 °C |
2.1 °C, 2009 |
0.7 °C, 2012 |
| Max 1hr Hum Rise |
3% |
16:05 |
6% |
13%, 2011 |
2%, 2016 |
| Max 10m Temp Fall |
0.3 °C |
01:24 |
0.4 °C |
0.6 °C, 2025 |
0.2 °C, 2013 |
| Max 1hr Temp Fall |
0.8 °C |
01:01 |
1.2 °C |
2.3 °C, 2010 |
0.5 °C, 2013 |
| Max 1hr Hum Fall |
6% |
12:14 |
7% |
16%, 2009 |
2%, 2016 |
| Max 10m Wind Speed |
8.9 mph |
04:46 |
9.0 mph |
15.2 mph, 2019 |
3.1 mph, 2016 |
| Minimum Feels-like |
5.3 °C |
04:42 |
7.3 °C |
15.1 °C, 2013 |
-1.5 °C, 2010 |
| Maximum Feels-like |
12.4 °C |
01:00 |
15.7 °C |
22.5 °C, 2013 |
9.4 °C, 2010 |
| Mean Feels-like |
9.6 °C |
|
12.0 °C |
18.3 °C, 2013 |
4.3 °C, 2010 |
| Air-frost Hrs |
0 hrs |
|
0 hrs |
0 hrs, 2009 |
0 hrs, 2009 |
| Measure | Value (anomaly) |
Month cumul. | Record High | Record Low |
| Temperature Range |
3.4 °C (-2.4) |
5.4 °C (-0.8) |
8.7 °C (+2.9), 2017 |
3.4 °C (-2.4), 2020 |
| Humidity Range |
13% |
19% |
38%, 2014 |
5%, 2016 |
| Pressure Range |
2 hPa |
7 hPa |
11 hPa, 2013 |
2 hPa, 2020 |
| Measure | Value [% of max] |
Month cumul. | Record High | Record Low |
| Sun Hours |
4.2 [47%] | 60 hrs (63%) [25%] |
8.8 [98%], 2010 |
0 [0%], 2019 |
| Wet Hours |
4
[Mean rain rate: 0.5 mm/h] | 113 hrs (285%) [19%] |
4, 2020 |
0, 2009 |
| Cloud Cover |
Partly Cloudy with periods of Mostly Sunny |
| Events |
None |
| Comments |
o.night, am rn/shs |
| Extra Comments |
|
| Issues |
None known |
| Observer Absent? |
Yes - observations may be unreliable |
| Pond Temperature @ Hampstead Heath |
10.0 °C |


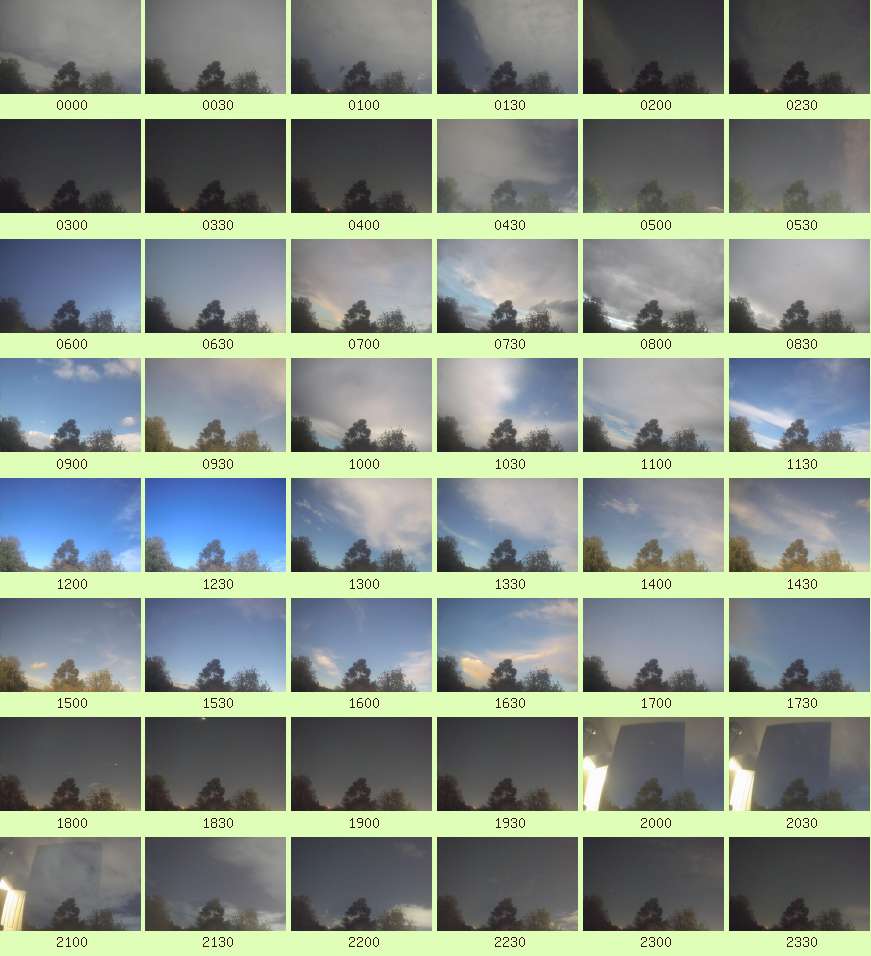 Full resolution individual images at up-to 5 minute intervals