| Measure | Value (anomaly) | Time |
Month cumul. | Record High | Record Low |
| Minimum Temperature |
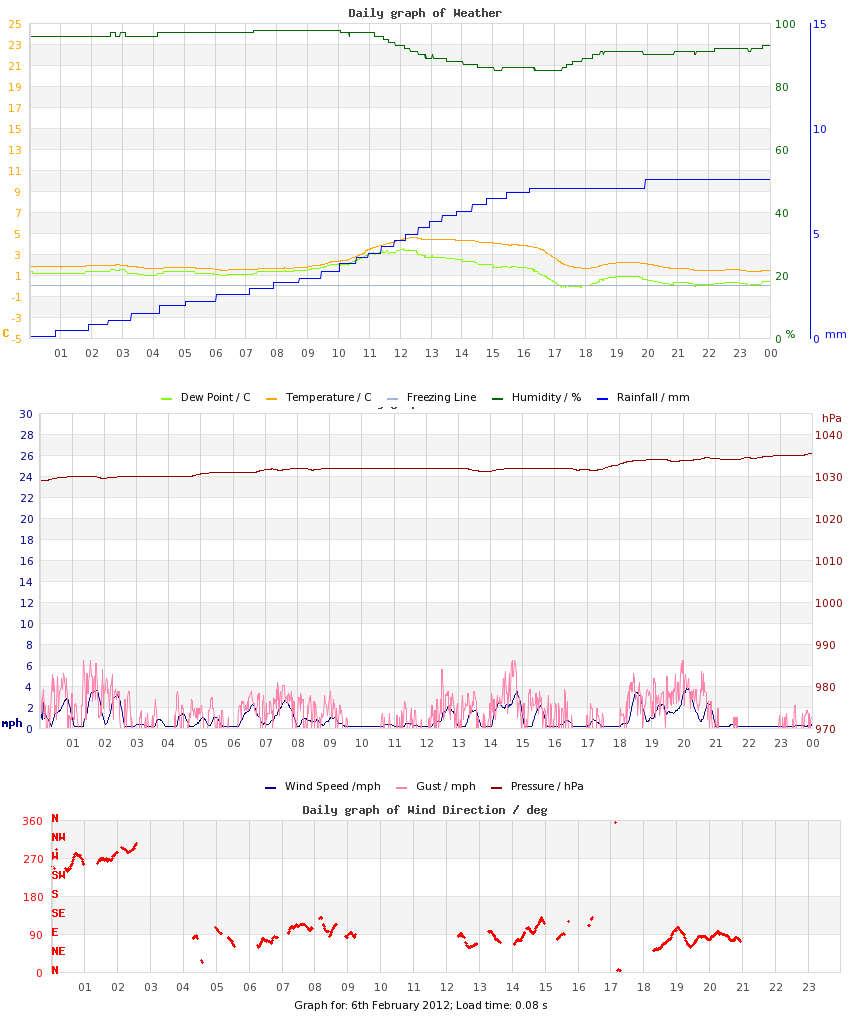
1.3 °C (-1.7) |
23:28 |
-2.1 °C (-5.1) |
9.7 °C (+6.7), 2011 |
-0.8 °C (-3.8), 2018 |
| Maximum Temperature |
4.6 °C (-3.2) |
12:25 |
2.1 °C (-5.8) |
13.8 °C (+6.0), 2024 |
1.1 °C (-6.7), 2009 |
| Mean Temperature |
2.3 °C (-2.4) |
|
-0.2 °C (-5.4) |
12.1 °C, 2024 |
0.7 °C, 2009 |
| Minimum Humidity |
85% |
16:30 |
63% |
91%, 2026 |
54%, 2015 |
| Maximum Humidity |
98% |
08:37 |
84% |
98%, 2009 |
84%, 2011 |
| Mean Humidity |
93% |
|
74% |
96%, 2010 |
72%, 2015 |
| Minimum Pressure |
1030 hPa |
00:59 |
1029 hPa |
1040 hPa, 2023 |
980 hPa, 2014 |
| Maximum Pressure |
1036 hPa |
23:50 |
1036 hPa |
1046 hPa, 2023 |
992 hPa, 2009 |
| Mean Pressure |
1033 hPa |
|
1033 hPa |
1043 hPa, 2023 |
987 hPa, 2026 |
| Mean Wind Speed |
0.9 mph (-4.2) |
|
4.2 mph (-0.8) |
12.9 mph, 2022 |
0.9 mph, 2012 |
| Maximum Wind Speed |
5.9 mph |
|
12.0 mph |
25.9 mph, 2016 |
5.9 mph, 2012 |
| Maximum Gust |
7.4 mph |
01:20 |
17.5 mph |
38.8 mph, 2022 |
7.4 mph, 2012 |
| Mean Wind Direction |
SE |
|
|
|
|
| Rainfall |
0.0 mm |
|
12.0 mm (129%) |
9.0 mm, 2026 |
|
| Maximum Hourly Rain |
n/a |
12:11 |
|
4.6, 2024 |
|
| Maximum 10-min Rain |
n/a |
19:56 |
|
2, 2024 |
|
| Maximum Rain Rate |
n/a |
|
|
20, 2016 |
|
| Minimum Dew Point |
-0.2 °C |
17:33 |
-6.6 °C |
6.9 °C, 2026 |
-4.5 °C, 2018 |
| Maximum Dew Point |
3.5 °C |
12:07 |
-2.2 °C |
10.6 °C, 2024 |
-1.5 °C, 2015 |
| Mean Dew Point |
1.3 °C |
|
-4.5 °C |
9.2 °C, 2024 |
-2.8 °C, 2015 |
| Measure | Value | Time |
Month cumul. | Record High | Record Low |
| Night Minimum (21-09) |
* 1.1 °C * |
21:00 |
-2.3 °C |
10.8 °C, 2024 |
-0.1 °C, 2015 |
| Day Maximum (09-21) |
4.6 °C |
12:24 |
2.1 °C |
13.8 °C, 2024 |
1.1 °C, 2009 |
| Max 10m Temp Rise |
0.3 °C |
10:26 |
0.4 °C |
0.9 °C, 2023 |
0.2 °C, 2009 |
| Max 1hr Temp Rise |
1.3 °C |
11:12 |
1.6 °C |
2.8 °C, 2023 |
0.3 °C, 2009 |
| Max 1hr Hum Rise |
5% |
18:13 |
6% |
13%, 2016 |
3%, 2009 |
| Max 10m Temp Fall |
0.5 °C |
17:13 |
0.3 °C |
2.8 °C, 2024 |
0.2 °C, 2011 |
| Max 1hr Temp Fall |
1.7 °C |
17:17 |
1.1 °C |
6.2 °C, 2024 |
0.5 °C, 2019 |
| Max 1hr Hum Fall |
5% |
12:08 |
10% |
13%, 2013 |
1%, 2014 |
| Max 10m Wind Speed |
3.8 mph |
20:06 |
8.5 mph |
20.5 mph, 2016 |
3.8 mph, 2012 |
| Minimum Feels-like |
-1.2 °C |
01:21 |
-6.2 °C |
6.3 °C, 2011 |
-5.9 °C, 2015 |
| Maximum Feels-like |
4.6 °C |
12:17 |
1.1 °C |
15.1 °C, 2024 |
1.1 °C, 2018 |
| Mean Feels-like |
2.0 °C |
|
-2.5 °C |
12.9 °C, 2024 |
-2.5 °C, 2015 |
| Air-frost Hrs |
0 hrs |
|
10 hrs |
4 hrs, 2018 |
0 hrs, 2009 |
| Measure | Value (anomaly) |
Month cumul. | Record High | Record Low |
| Temperature Range |
3.3 °C (-1.5) |
4.2 °C (-0.7) |
8.7 °C (+3.9), 2024 |
0.8 °C (-4.0), 2009 |
| Humidity Range |
13% |
21% |
41%, 2023 |
5%, 2026 |
| Pressure Range |
6 hPa |
7 hPa |
24 hPa, 2013 |
1 hPa, 2011 |
| Measure | Value [% of max] |
Month cumul. | Record High | Record Low |
| Sun Hours |
0.3 [4%] | 26 hrs (163%) [51%] |
8.4 [100%], 2023 |
0 [0%], 2009 |
| Wet Hours |
0 | 9.5 hrs (88%) [6.6%] |
11, 2014 |
, 2009 |
| Cloud Cover |
Overcast with periods of Mostly Cloudy |
| Events |
Lying Snow (at 09z): ~3 cm |
| Comments |
Ly Snow to 3cm |
| Extra Comments |
|
| Issues |
None known |
| Observer Absent? |
Yes - observations may be unreliable |
| Pond Temperature @ Hampstead Heath |
0.0 °C |