


Daily Report for 2nd October 2026
| <<Previous Day | Reset | Next Day>> |
| Measure | Value (anomaly) | Time | Month cumul. | Record High | Record Low |
| Minimum Temperature | 9.4 °C (-0.6) | 05:40 | 11.6 °C (+1.6) | 16.3 °C (+6.3), 2023 | 5.2 °C (-4.8), 2019 |
| Maximum Temperature | 21.1 °C (+4.4) | 14:35 | 20.9 °C (+4.3) | 26.6 °C (+9.9), 2011 | 13.2 °C (-3.5), 2019 |
| Mean Temperature | 15.8 °C (+1.9) | 16.3 °C (+2.9) | 19.4 °C, 2011 | 9.2 °C, 2019 | |
| Minimum Humidity | 49% | 14:19 | 49% | 85%, 2020 | 36%, 2011 |
| Maximum Humidity | 91% | 07:57 | 90% | 98%, 2010 | 80%, 2009 |
| Mean Humidity | 71% | 72% | 93%, 2020 | 63%, 2011 | |
| Minimum Pressure | 1030 hPa | 16:48 | 1023 hPa | 1030 hPa, 2026 | 985 hPa, 2021 |
| Maximum Pressure | 1032 hPa | 10:06 | 1031 hPa | 1032 hPa, 2026 | 993 hPa, 2020 |
| Mean Pressure | 1031 hPa | 1027 hPa | 1031 hPa, 2026 | 990 hPa, 2020 | |
| Mean Wind Speed | 4.2 mph (+0.1) | 4.0 mph (-0.1) | 9.0 mph, 2017 | 1.8 mph, 2014 | |
| Maximum Wind Speed | 13.8 mph | 12:37 | 12.9 mph | 17.4 mph, 2020 | 7.8 mph, 2014 |
| Maximum Gust | 23.0 mph | 13:48 | 20.7 mph | 30.0 mph, 2020 | 9.7 mph, 2014 |
| Mean Wind Direction | WSW | ||||
| Rainfall | 0.0 mm | 0.8 mm (19%) | 31.0 mm, 2020 | ||
| Maximum Hourly Rain | n/a | 11.2, 2010 | |||
| Maximum 10-min Rain | n/a | 2.7, 2023 | |||
| Maximum Rain Rate | n/a | 48, 2024 | |||
| Minimum Dew Point | 7.3 °C | 05:40 | 7.9 °C | 15.0 °C, 2023 | 3.4 °C, 2019 |
| Maximum Dew Point | 12.9 °C | 10:04 | 13.2 °C | 17.4 °C, 2023 | 8.7 °C, 2019 |
| Mean Dew Point | 10.3 °C | 10.8 °C | 16.2 °C, 2023 | 5.5 °C, 2019 | |
| Measure | Value | Time | Month cumul. | Record High | Record Low |
| Night Minimum (21-09) | 9.4 °C | 05:40 | 11.6 °C | 16.3 °C, 2023 | 6.2 °C, 2019 |
| Day Maximum (09-21) | 21.1 °C | 14:35 | 20.9 °C | 26.6 °C, 2011 | 12.7 °C, 2020 |
| Max 10m Temp Rise | 0.8 °C | 08:21 | 0.7 °C | 1.0 °C, 2011 | 0.2 °C, 2020 |
| Max 1hr Temp Rise | 4.1 °C | 08:55 | 3.0 °C | 5.0 °C, 2011 | 0.8 °C, 2020 |
| Max 1hr Hum Rise | 7% | 20:29 | 10% | 12%, 2011 | 4%, 2020 |
| Max 10m Temp Fall | 0.5 °C | 12:07 | 0.6 °C | 0.7 °C, 2022 | 0.3 °C, 2013 |
| Max 1hr Temp Fall | 1.5 °C | 03:10 | 1.8 °C | 2.8 °C, 2016 | 0.7 °C, 2023 |
| Max 1hr Hum Fall | 14% | 09:17 | 12% | 14%, 2019 | 4%, 2020 |
| Max 10m Wind Speed | 9.9 mph | 12:00 | 9.4 mph | 14.3 mph, 2017 | 5.6 mph, 2010 |
| Minimum Feels-like | 9.1 °C | 05:29 | 12.0 °C | 20.5 °C, 2023 | 2.5 °C, 2019 |
| Maximum Feels-like | 22.5 °C | 14:35 | 22.4 °C | 29.0 °C, 2011 | 13.2 °C, 2019 |
| Mean Feels-like | 17.2 °C | 17.9 °C | 22.4 °C, 2023 | 8.5 °C, 2019 | |
| Air-frost Hrs | 0 hrs | 0 hrs | 0 hrs, 2009 | 0 hrs, 2009 | |
| Minimum PM2.5 | 1 | 15:20 | 1 | 1, 2026 | 0, 2021 |
| Maximum PM2.5 | 4 | 12:25 | 6 | 4, 2026 | 4, 2026 |
| Mean PM2.5 | 2 | 3 | 2, 2026 | 2, 2026 | |
| Measure | Value (anomaly) | Month cumul. | Record High | Record Low | |
| Temperature Range | 11.7 °C (+5.0) | 9.3 °C (+2.7) | 14.8 °C (+8.1), 2011 | 3.2 °C (-3.5), 2023 | |
| Humidity Range | 42% | 41% | 57%, 2011 | 11%, 2020 | |
| Pressure Range | 3 hPa | 8 hPa | 28 hPa, 2021 | 3 hPa, 2026 | |
| Measure | Value [% of max] | Month cumul. | Record High | Record Low | |
| Sun Hours | 9.9 [95%] | 18 hrs (221%) [88%] | 10.4 [100%], 2011 | 0 [0%], 2020 | |
| Wet Hours | 0 | 1 hrs (32%) [2.1%] | 20, 2020 | 0, 2009 | |
| Cloud Cover | unknown | ||||
| Events | None | ||||
| Comments | data is awaiting quality control from site operator | ||||
| Extra Comments | |||||
| Issues | None known | ||||
| Observer Absent? | Yes - observations may be unreliable | ||||
| Pond Temperature @ Hampstead Heath | 17.0 °C | ||||
- Notes
- Detailed daily weather report for Hampstead nw3 in London on 2nd October 2026.
Times of extremes are computed using the midpoint of the longest continuous period at that extreme value.
Cumulative anomalies are reported according to the expected value for the month-to-date rather than month-end.
Sun hrs are derived based on analysis of webcam observations, but may use data from our closest site, Heathrow, when needed.
Wet hrs are dervied algorithmically from rainfall data, though may be adjusted manually.
Rainfall totals may be manually adjusted after the fact to correct delayed or erroneous data.
Cloud cover and Events are manually reported, often with multi-week delays.
Data is generally reliable and accurate but should always be viewed with some quantity of salt to hand.
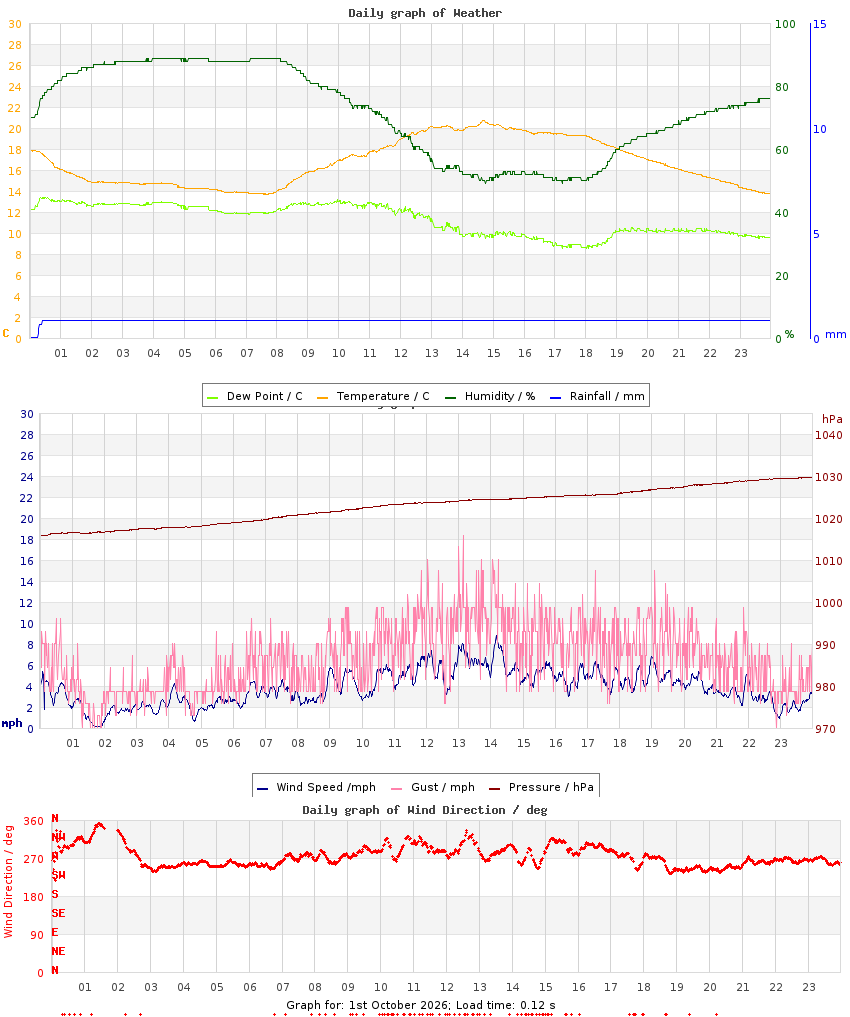
Daily Graph of Conditions
Webcam Summary of Cloud Conditions
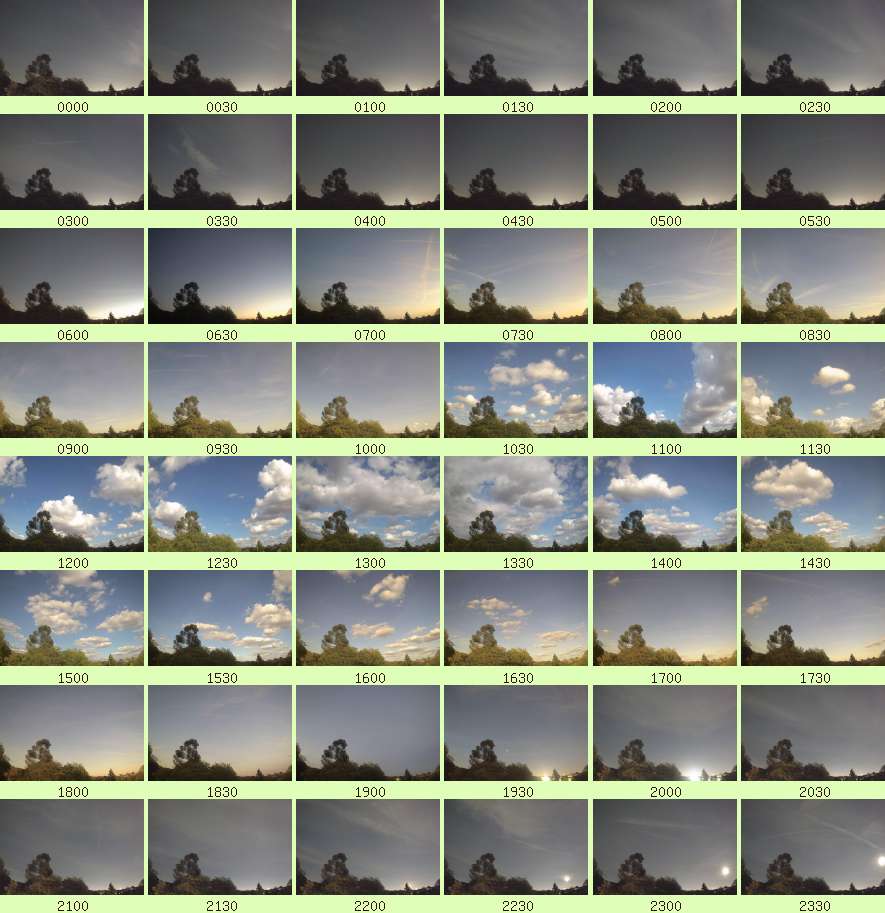 Full resolution individual images at up-to 5 minute intervals