| Measure | Value (anomaly) | Time |
Month cumul. | Record High | Record Low |
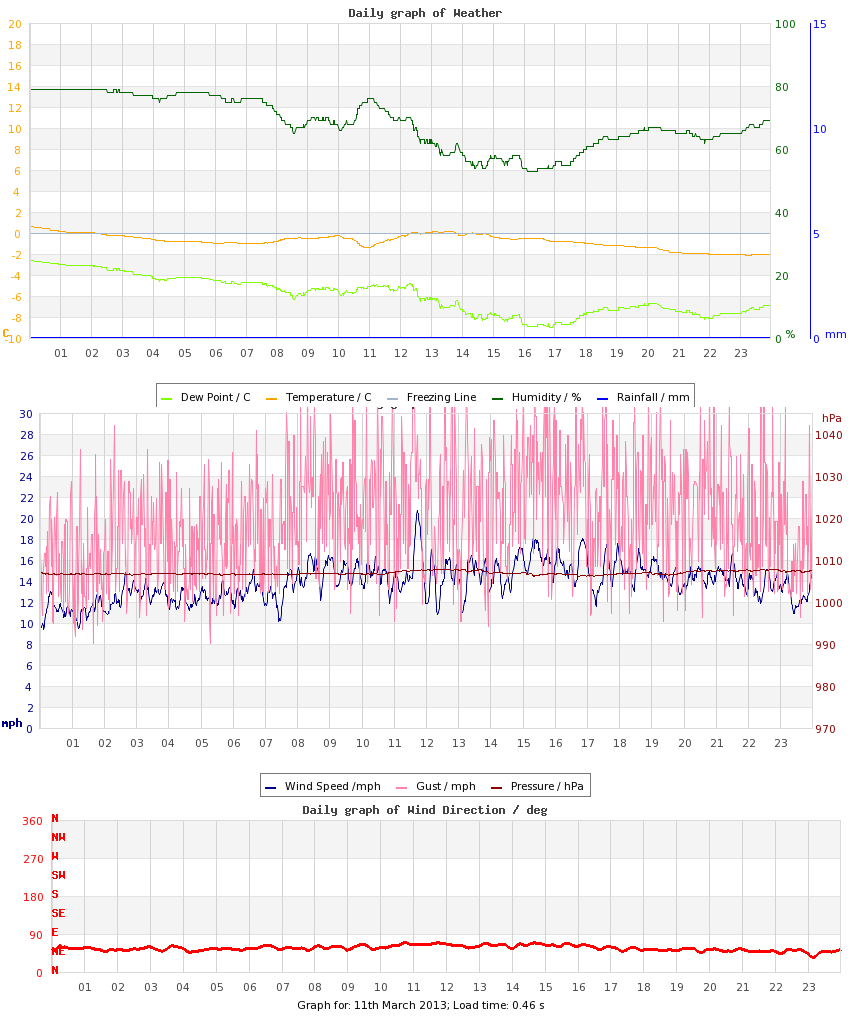
| Minimum Temperature |
-2.1 °C (-6.1) |
23:16 |
2.4 °C (-1.3) |
11.0 °C (+7.0), 2017 |
-2.4 °C (-6.4), 2023 |
| Maximum Temperature |
0.6 °C (-9.8) |
00:04 |
7.9 °C (-2.1) |
16.9 °C (+6.5), 2017 |
0.6 °C (-9.8), 2013 |
| Mean Temperature |
-0.8 °C (-8.0) |
|
5.1 °C (-1.7) |
13.4 °C, 2017 |
-0.8 °C, 2013 |
| Minimum Humidity |
53% |
16:16 |
65% |
89%, 2024 |
46%, 2015 |
| Maximum Humidity |
79% |
01:27 |
90% |
97%, 2009 |
79%, 2013 |
| Mean Humidity |
68% |
|
80% |
93%, 2024 |
66%, 2019 |
| Minimum Pressure |
1007 hPa |
05:03 |
1008 hPa |
1034 hPa, 2012 |
988 hPa, 2018 |
| Maximum Pressure |
1008 hPa |
17:22 |
1012 hPa |
1038 hPa, 2012 |
997 hPa, 2018 |
| Mean Pressure |
1007 hPa |
|
1010 hPa |
1036 hPa, 2012 |
992 hPa, 2018 |
| Mean Wind Speed |
13.9 mph (+8.7) |
|
4.9 mph (-0.3) |
15.1 mph, 2021 |
1.4 mph, 2016 |
| Maximum Wind Speed |
27.3 mph |
12:06 |
12.4 mph |
29.5 mph, 2020 |
6.7 mph, 2016 |
| Maximum Gust |
38.9 mph |
15:21 |
17.8 mph |
45.6 mph, 2021 |
8.7 mph, 2012 |
| Mean Wind Direction |
ENE |
|
|
|
|
| Rainfall / Snow-melt approx. |
0.3 mm |
|
19.8 mm (143%) |
3.6 mm, 2022 |
|
| Maximum Hourly Rain |
n/a |
|
|
2.4, 2018 |
|
| Maximum 10-min Rain |
n/a |
|
|
2, 2018 |
|
| Maximum Rain Rate |
n/a |
|
|
40, 2018 |
|
| Minimum Dew Point |
-9.0 °C |
16:53 |
-0.9 °C |
6.5 °C, 2017 |
-9.0 °C, 2013 |
| Maximum Dew Point |
-2.6 °C |
00:04 |
4.0 °C |
11.0 °C, 2017 |
-2.6 °C, 2013 |
| Mean Dew Point |
-6.0 °C |
|
1.7 °C |
9.0 °C, 2017 |
-6.0 °C, 2013 |
| Measure | Value | Time |
Month cumul. | Record High | Record Low |
| Night Minimum (21-09) |
* -1.0 °C * |
06:49 |
3.2 °C |
11.0 °C, 2017 |
-2.4 °C, 2023 |
| Day Maximum (09-21) |
* 0.2 °C * |
13:23 |
7.8 °C |
16.9 °C, 2017 |
0.2 °C, 2013 |
| Max 10m Temp Rise |
0.3 °C |
11:13 |
0.3 °C |
1.1 °C, 2011 |
0.2 °C, 2014 |
| Max 1hr Temp Rise |
1.2 °C |
12:01 |
1.2 °C |
2.8 °C, 2012 |
0.3 °C, 2024 |
| Max 1hr Hum Rise |
10% |
11:01 |
5% |
17%, 2023 |
2%, 2024 |
| Max 10m Temp Fall |
0.5 °C |
10:41 |
0.3 °C |
1.0 °C, 2020 |
0.1 °C, 2024 |
| Max 1hr Temp Fall |
1.2 °C |
10:52 |
1.1 °C |
2.3 °C, 2012 |
0.3 °C, 2024 |
| Max 1hr Hum Fall |
12% |
13:17 |
7% |
15%, 2023 |
2%, 2024 |
| Max 10m Wind Speed |
20.7 mph |
11:43 |
9.3 mph |
21.6 mph, 2021 |
3.8 mph, 2016 |
| Minimum Feels-like |
-11.0 °C |
22:28 |
-1.3 °C |
11.4 °C, 2017 |
-11.0 °C, 2013 |
| Maximum Feels-like |
-3.9 °C |
01:39 |
7.1 °C |
18.7 °C, 2017 |
-3.9 °C, 2013 |
| Mean Feels-like |
-7.6 °C |
|
3.0 °C |
14.2 °C, 2017 |
-7.6 °C, 2013 |
| Air-frost Hrs |
20 hrs |
|
3 hrs |
20 hrs, 2013 |
0 hrs, 2009 |
| Minimum PM2.5 |
0 |
|
0 |
0, 2009 |
0, 2012 |
| Maximum PM2.5 |
n/a |
|
0 |
n/a |
n/a |
| Mean PM2.5 |
n/a |
|
0 |
n/a |
n/a |
| Measure | Value (anomaly) |
Month cumul. | Record High | Record Low |
| Temperature Range |
2.7 °C (-3.7) |
5.6 °C (-0.8) |
11.9 °C (+5.5), 2009 |
1.1 °C (-5.3), 2024 |
| Humidity Range |
26% |
25% |
44%, 2026 |
7%, 2024 |
| Pressure Range |
1 hPa |
5 hPa |
16 hPa, 2021 |
1 hPa, 2013 |
| Measure | Value [% of max] |
Month cumul. | Record High | Record Low |
| Sun Hours |
0.1 [1%] | 22 hrs (57%) [19%] |
9 [87%], 2016 |
0 [0%], 2022 |
| Wet Hours |
1 | 44 hrs (234%) [17%] |
5, 2022 |
, 2009 |
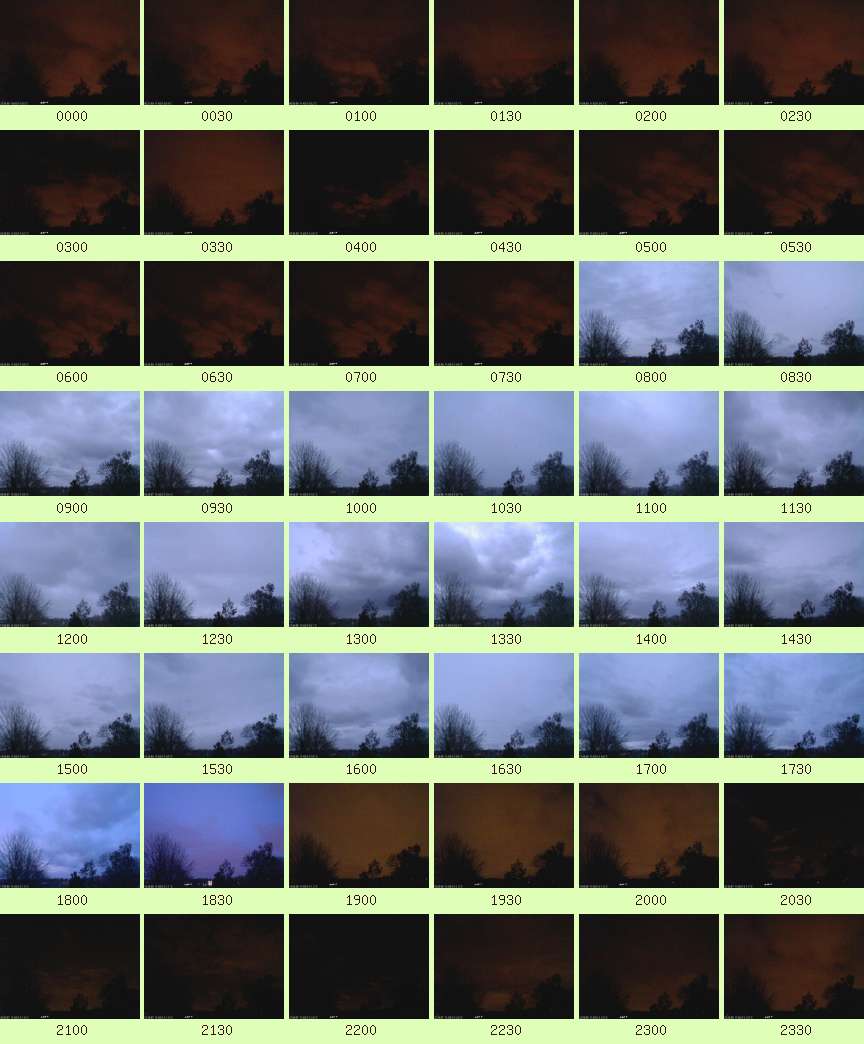
| Cloud Cover |
Overcast |
| Events |
Snowfall: ~0.3 cm
Air Frost |
| Comments |
10-16 occasional. Snow Showers |
| Extra Comments |
|
| Issues |
None known |
| Observer Absent? |
No |
| Pond Temperature @ Hampstead Heath |
0.0 °C |


 Large resolution version
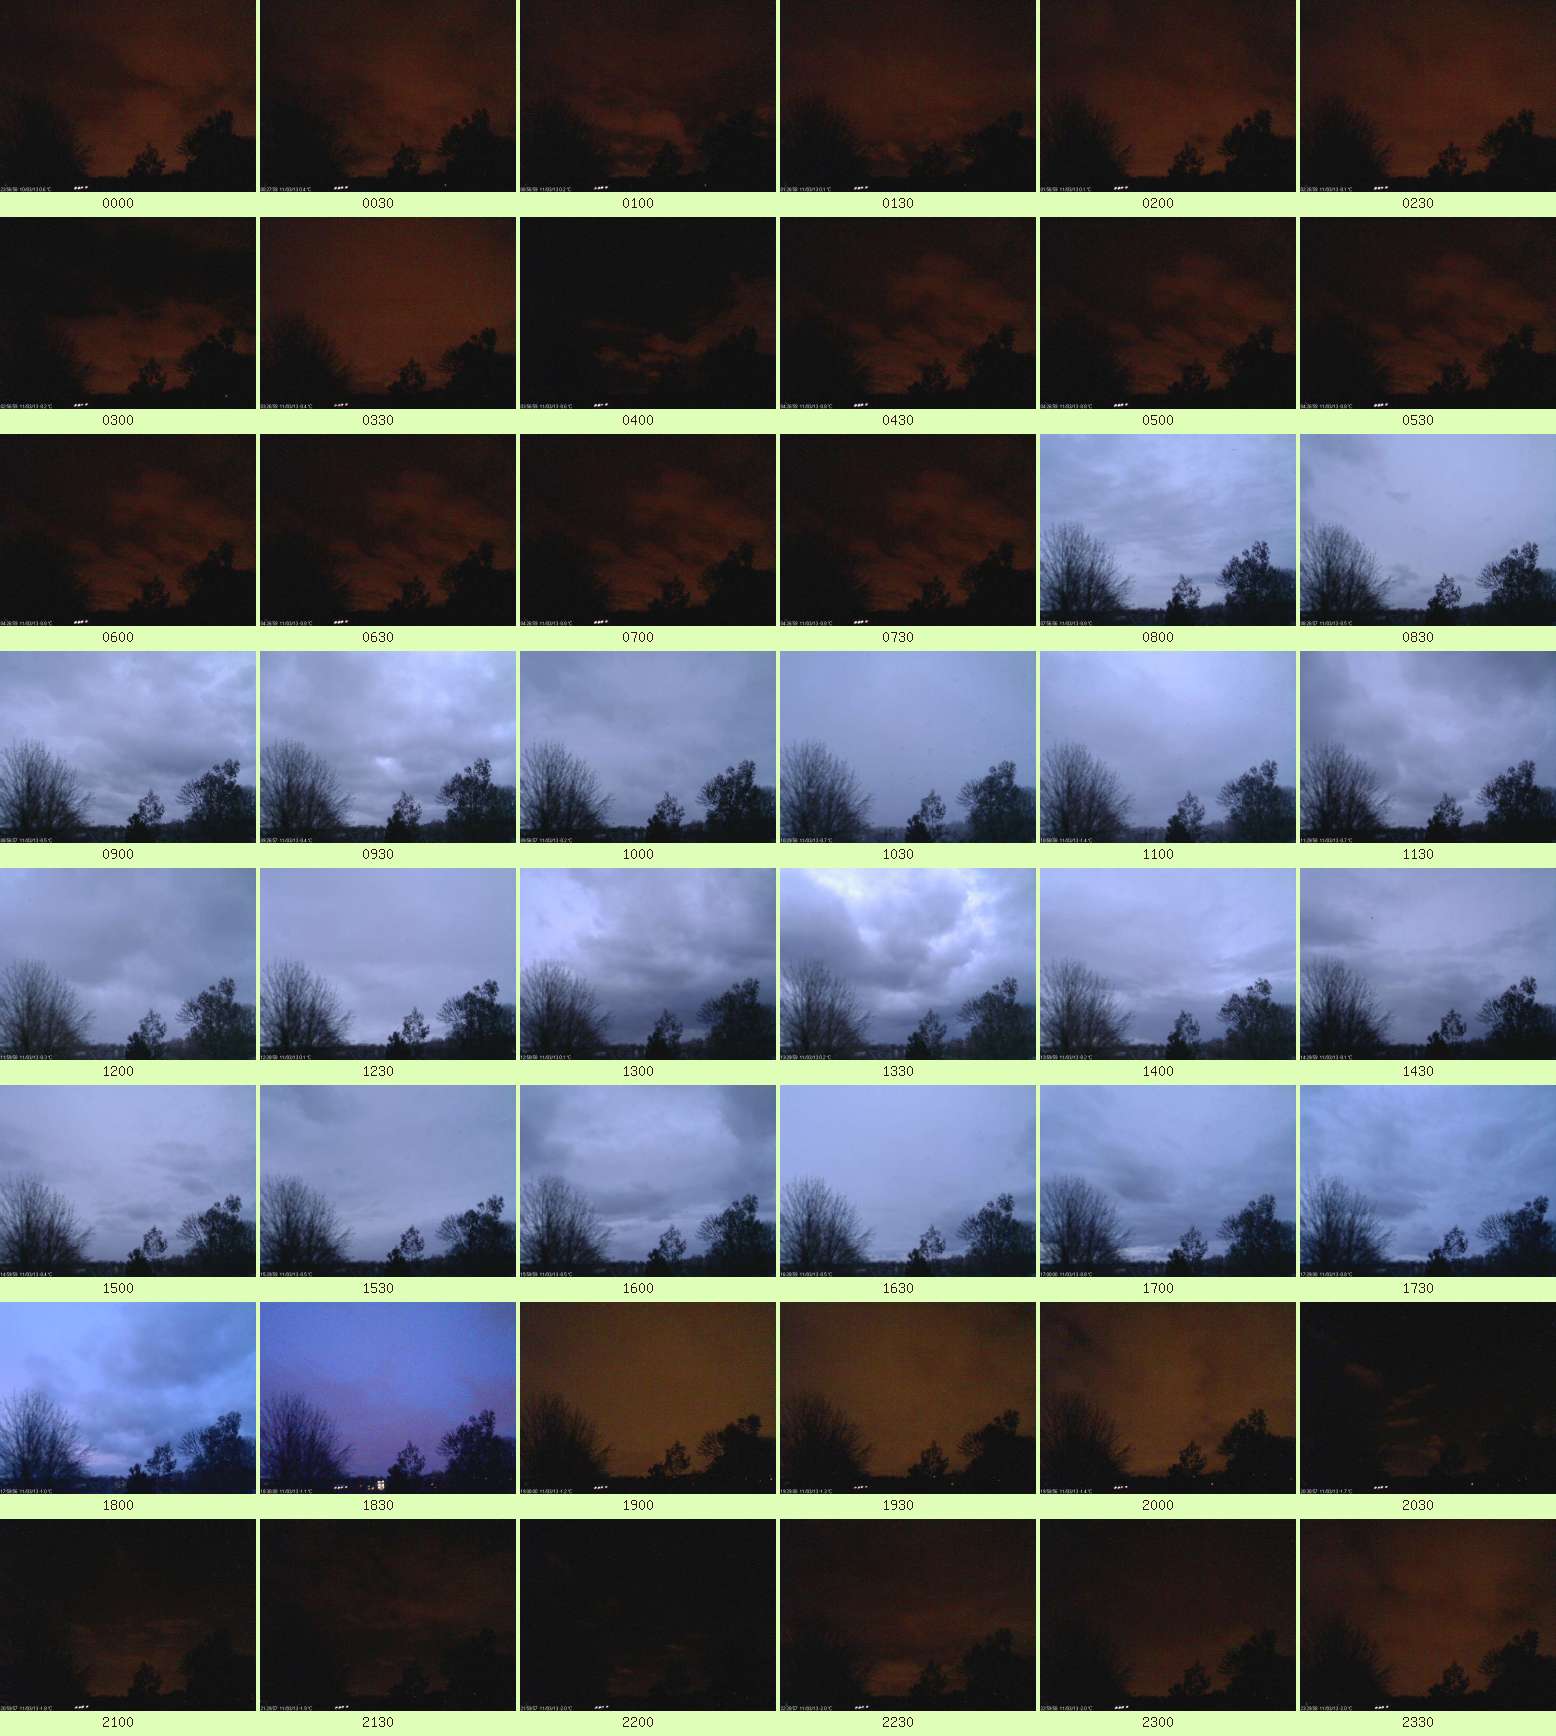