| Measure | Value (anomaly) | Time |
Month cumul. | Record High | Record Low |
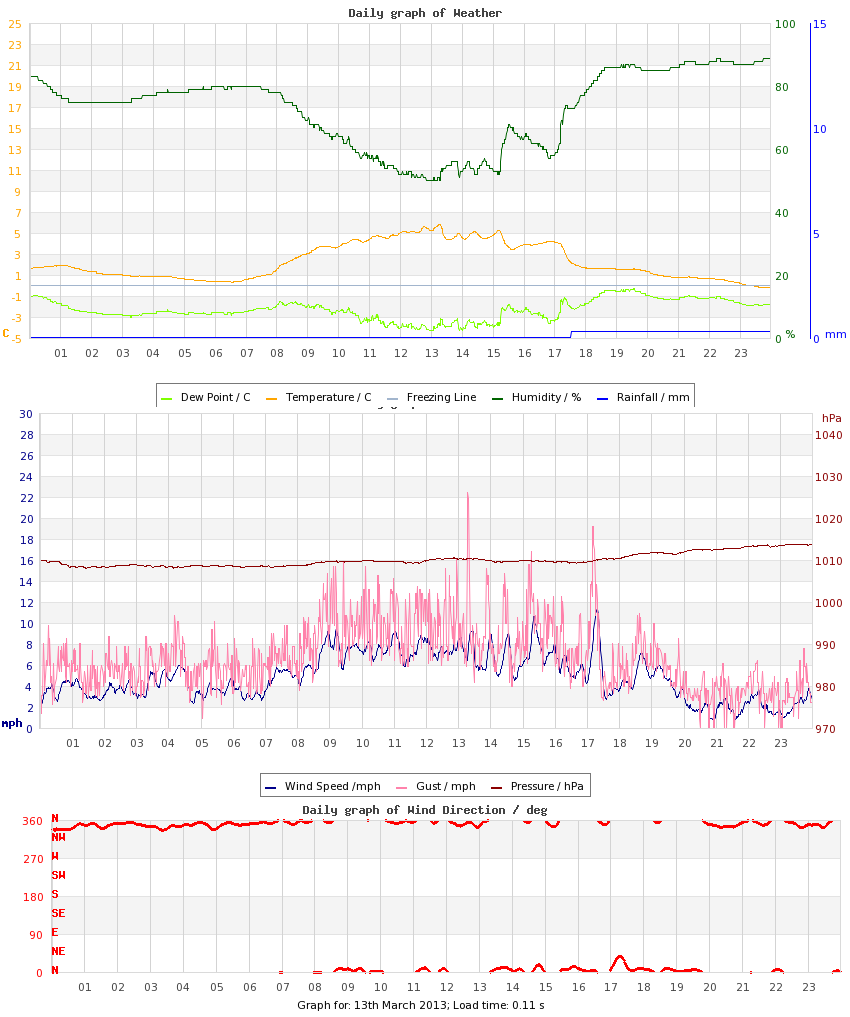
| Minimum Temperature |
-0.2 °C (-4.3) |
23:47 |
1.8 °C (-1.9) |
10.6 °C (+6.5), 2024 |
-0.2 °C (-4.3), 2013 |
| Maximum Temperature |
5.8 °C (-4.8) |
13:15 |
7.5 °C (-2.7) |
16.7 °C (+6.1), 2014 |
5.8 °C (-4.8), 2013 |
| Mean Temperature |
2.2 °C (-4.6) |
|
4.6 °C (-2.3) |
12.2 °C, 2023 |
2.2 °C, 2013 |
| Minimum Humidity |
50% |
13:03 |
62% |
81%, 2024 |
37%, 2015 |
| Maximum Humidity |
89% |
23:59 |
89% |
97%, 2014 |
76%, 2015 |
| Mean Humidity |
73% |
|
77% |
88%, 2012 |
52%, 2015 |
| Minimum Pressure |
1008 hPa |
03:07 |
1008 hPa |
1034 hPa, 2012 |
987 hPa, 2023 |
| Maximum Pressure |
1014 hPa |
22:52 |
1012 hPa |
1035 hPa, 2012 |
997 hPa, 2023 |
| Mean Pressure |
1010 hPa |
|
1010 hPa |
1034 hPa, 2012 |
991 hPa, 2023 |
| Mean Wind Speed |
4.9 mph (-0.3) |
|
5.4 mph (+0.2) |
14.2 mph, 2023 |
1.4 mph, 2014 |
| Maximum Wind Speed |
16.3 mph |
17:10 |
13.7 mph |
26.7 mph, 2023 |
6.4 mph, 2014 |
| Maximum Gust |
22.5 mph |
13:17 |
19.8 mph |
42.6 mph, 2023 |
8.5 mph, 2014 |
| Mean Wind Direction |
N |
|
|
|
|
| Rainfall / Snow-melt approx. |
0.3 mm |
|
20.1 mm (123%) |
9.8 mm, 2026 |
|
| Maximum Hourly Rain |
0.3 mm |
17:32 |
|
7.2 mm, 2026 |
|
| Maximum 10-min Rain |
0.3 mm |
17:32 |
|
4.0 mm, 2026 |
|
| Maximum Rain Rate |
n/a |
|
|
36, 2026 |
|
| Minimum Dew Point |
-4.3 °C |
13:28 |
-1.9 °C |
8.6 °C, 2024 |
-4.3 °C, 2013 |
| Maximum Dew Point |
-0.3 °C |
19:33 |
3.3 °C |
10.9 °C, 2023 |
-0.3 °C, 2013 |
| Mean Dew Point |
-2.3 °C |
|
0.7 °C |
9.7 °C, 2024 |
-2.3 °C, 2013 |
| Measure | Value | Time |
Month cumul. | Record High | Record Low |
| Night Minimum (21-09) |
* 0.3 °C * |
06:33 |
2.6 °C |
11.0 °C, 2024 |
0.3 °C, 2013 |
| Day Maximum (09-21) |
5.8 °C |
13:15 |
7.3 °C |
16.7 °C, 2014 |
5.8 °C, 2013 |
| Max 10m Temp Rise |
0.6 °C |
08:08 |
0.4 °C |
0.9 °C, 2025 |
0.2 °C, 2011 |
| Max 1hr Temp Rise |
1.9 °C |
08:49 |
1.3 °C |
3.5 °C, 2014 |
0.8 °C, 2011 |
| Max 1hr Hum Rise |
20% |
17:49 |
7% |
20%, 2013 |
2%, 2024 |
| Max 10m Temp Fall |
1.3 °C |
15:23 |
0.4 °C |
2.1 °C, 2025 |
0.2 °C, 2024 |
| Max 1hr Temp Fall |
2.5 °C |
17:51 |
1.2 °C |
3.0 °C, 2026 |
0.8 °C, 2019 |
| Max 1hr Hum Fall |
10% |
09:04 |
8% |
19%, 2014 |
3%, 2024 |
| Max 10m Wind Speed |
11.4 mph |
17:18 |
10.3 mph |
20.9 mph, 2023 |
4.9 mph, 2012 |
| Minimum Feels-like |
-4.1 °C |
23:43 |
-2.2 °C |
11.4 °C, 2024 |
-4.1 °C, 2013 |
| Maximum Feels-like |
3.7 °C |
13:14 |
6.5 °C |
16.7 °C, 2014 |
3.7 °C, 2013 |
| Mean Feels-like |
-0.5 °C |
|
2.2 °C |
13.1 °C, 2023 |
-0.5 °C, 2013 |
| Air-frost Hrs |
0.6 hrs |
|
3 hrs |
0.6 hrs, 2013 |
0 hrs, 2009 |
| Minimum PM2.5 |
0 |
|
0 |
0, 2009 |
0, 2012 |
| Maximum PM2.5 |
n/a |
|
0 |
n/a |
n/a |
| Mean PM2.5 |
n/a |
|
0 |
n/a |
n/a |
| Measure | Value (anomaly) |
Month cumul. | Record High | Record Low |
| Temperature Range |
6.0 °C (-0.5) |
5.6 °C (-0.7) |
13.9 °C (+7.4), 2014 |
2.7 °C (-3.8), 2024 |
| Humidity Range |
39% |
27% |
58%, 2014 |
11%, 2024 |
| Pressure Range |
6 hPa |
5 hPa |
16 hPa, 2021 |
1 hPa, 2012 |
| Measure | Value [% of max] |
Month cumul. | Record High | Record Low |
| Sun Hours |
5 [48%] | 31 hrs (68%) [23%] |
8 [76%], 2014 |
0 [0%], 2022 |
| Wet Hours |
0.8 | 45 hrs (204%) [15%] |
4, 2026 |
, 2009 |
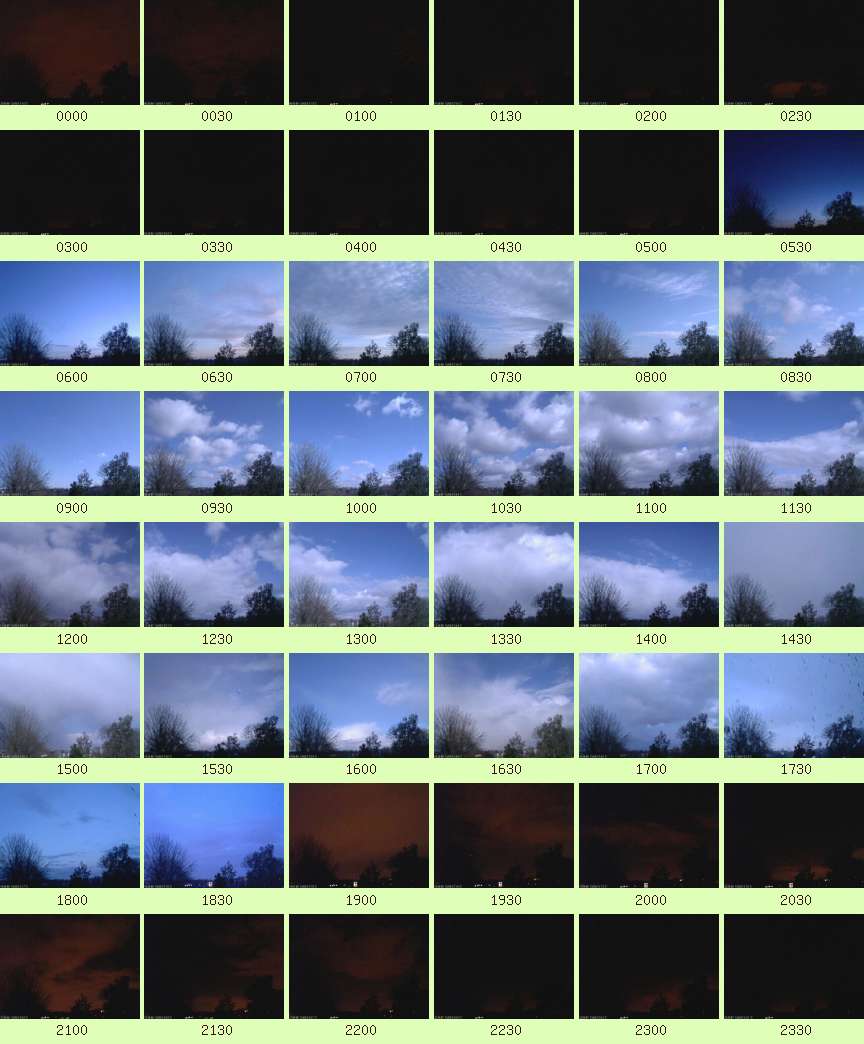
| Cloud Cover |
am: Mostly Cloudy transitioned to Partly Cloudy
pm: Overcast |
| Events |
Snowfall: ~0.3 cm |
| Comments |
13-18 Light-Moderate Snow Showers |
| Extra Comments |
|
| Issues |
None known |
| Observer Absent? |
No |
| Pond Temperature @ Hampstead Heath |
0.0 °C |


 Large resolution version
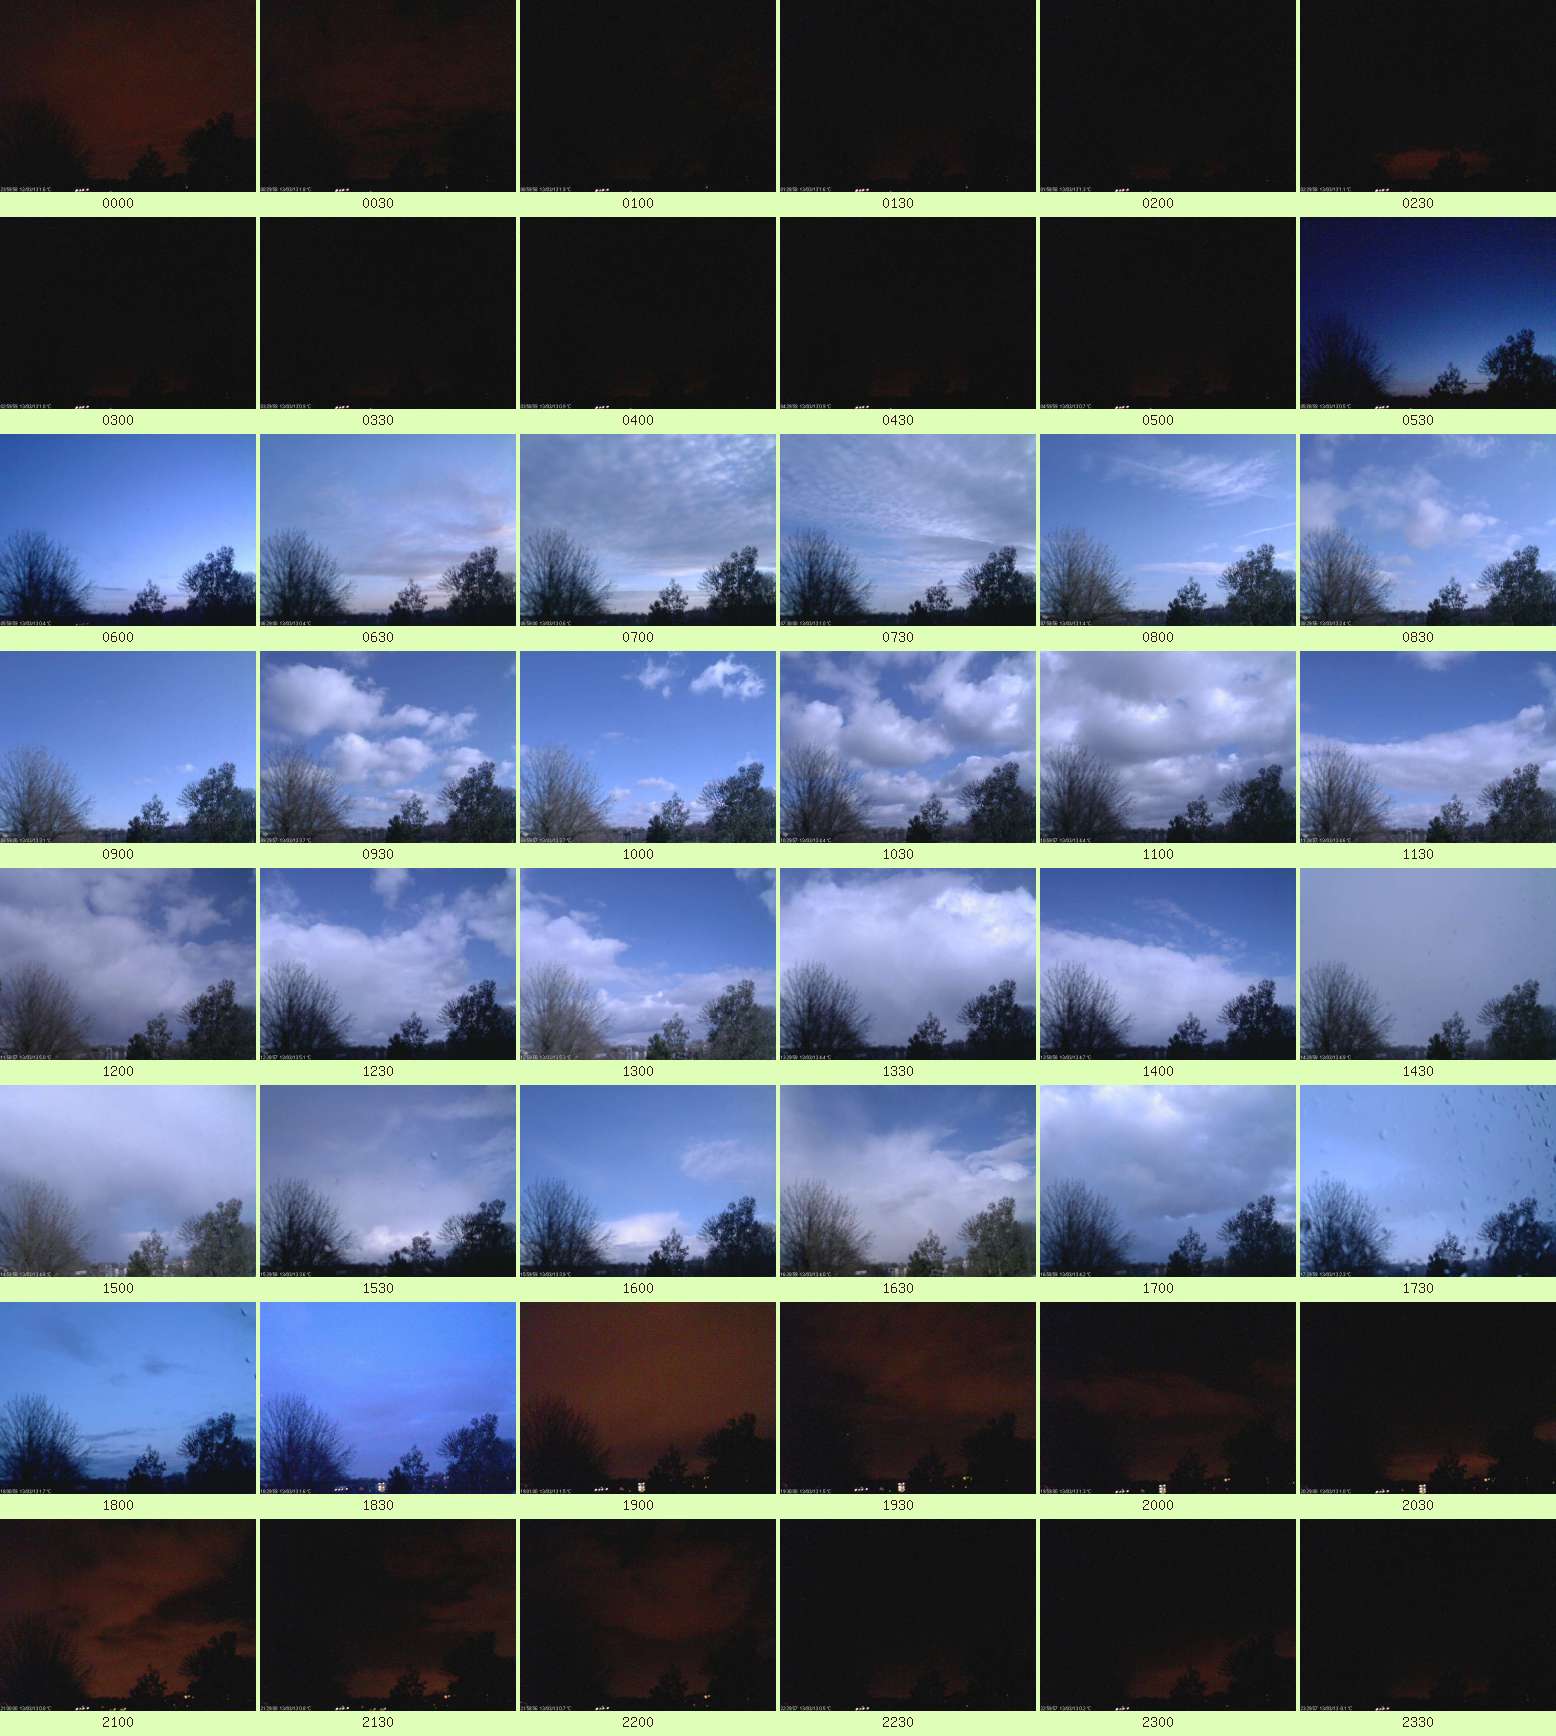