| Measure | Value (anomaly) | Time |
Month cumul. | Record High | Record Low |
| Minimum Temperature |
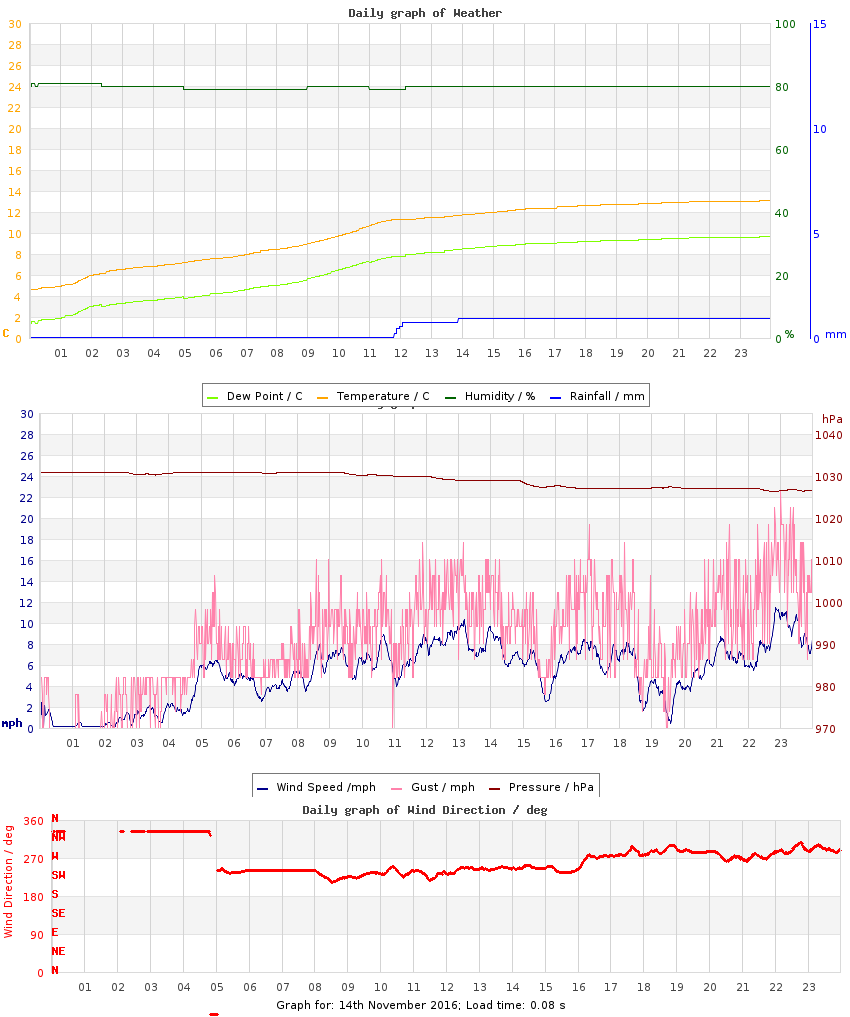
4.6 °C (-0.9) |
00:07 |
3.7 °C (-2.4) |
12.7 °C (+7.2), 2025 |
3.9 °C (-1.6), 2019 |
| Maximum Temperature |
13.1 °C (+2.6) |
23:48 |
9.7 °C (-1.5) |
15.4 °C (+4.9), 2009 |
8.2 °C (-2.3), 2019 |
| Mean Temperature |
10.1 °C (+0.8) |
|
6.8 °C (-2.0) |
13.3 °C, 2025 |
5.7 °C, 2019 |
| Minimum Humidity |
79% |
08:34 |
68% |
93%, 2025 |
62%, 2013 |
| Maximum Humidity |
81% |
01:10 |
81% |
98%, 2011 |
81%, 2016 |
| Mean Humidity |
80% |
|
76% |
96%, 2022 |
76%, 2013 |
| Minimum Pressure |
1026 hPa |
23:02 |
1010 hPa |
1031 hPa, 2024 |
988 hPa, 2009 |
| Maximum Pressure |
1031 hPa |
05:08 |
1018 hPa |
1034 hPa, 2024 |
1001 hPa, 2014 |
| Mean Pressure |
1029 hPa |
|
1014 hPa |
1032 hPa, 2024 |
996 hPa, 2019 |
| Mean Wind Speed |
5.2 mph (+0.6) |
|
5.2 mph (+0.6) |
9.9 mph, 2009 |
1.8 mph, 2022 |
| Maximum Wind Speed |
13.5 mph |
23:04 |
15.6 mph |
24.5 mph, 2009 |
6.7 mph, 2012 |
| Maximum Gust |
22.6 mph |
23:00 |
24.5 mph |
38.5 mph, 2009 |
9.4 mph, 2012 |
| Mean Wind Direction |
W |
|
|
|
|
| Rainfall |
0.9 mm |
|
42.9 mm (137%) |
12.4 mm, 2023 |
|
| Maximum Hourly Rain |
0.7 mm |
12:04 |
|
7.5 mm, 2014 |
|
| Maximum 10-min Rain |
0.4 mm |
11:53 |
|
2.4 mm, 2023 |
|
| Maximum Rain Rate |
2.2 mm/h |
11:53 |
|
24 mm/h, 2014 |
|
| Minimum Dew Point |
1.4 °C |
00:07 |
-0.1 °C |
11.8 °C, 2025 |
0.6 °C, 2013 |
| Maximum Dew Point |
9.7 °C |
23:48 |
5.3 °C |
13.0 °C, 2025 |
5.4 °C, 2019 |
| Mean Dew Point |
6.8 °C |
|
2.8 °C |
12.4 °C, 2025 |
3.5 °C, 2013 |
| Measure | Value | Time |
Month cumul. | Record High | Record Low |
| Night Minimum (21-09) |
* 4.5 °C * |
23:44 |
4.3 °C |
12.9 °C, 2025 |
4.1 °C, 2017 |
| Day Maximum (09-21) |
* 12.9 °C * |
20:43 |
9.7 °C |
14.1 °C, 2020 |
8.2 °C, 2019 |
| Max 10m Temp Rise |
0.3 °C |
01:33 |
0.4 °C |
0.5 °C, 2009 |
0.1 °C, 2011 |
| Max 1hr Temp Rise |
1.1 °C |
02:16 |
1.3 °C |
1.9 °C, 2009 |
0.4 °C, 2011 |
| Max 1hr Hum Rise |
1% |
01:01 |
4% |
10%, 2009 |
1%, 2011 |
| Max 10m Temp Fall |
0.0 °C |
00:10 |
0.3 °C |
1.2 °C, 2023 |
0.0 °C, 2016 |
| Max 1hr Temp Fall |
0.0 °C |
17:03 |
1.3 °C |
2.4 °C, 2014 |
0.0 °C, 2016 |
| Max 1hr Hum Fall |
1% |
02:19 |
5% |
19%, 2009 |
1%, 2015 |
| Max 10m Wind Speed |
11.5 mph |
22:51 |
12.1 mph |
17.2 mph, 2009 |
5.0 mph, 2012 |
| Minimum Feels-like |
2.7 °C |
00:01 |
-0.1 °C |
14.9 °C, 2025 |
0.5 °C, 2019 |
| Maximum Feels-like |
14.2 °C |
23:38 |
9.2 °C |
17.1 °C, 2009 |
8.2 °C, 2019 |
| Mean Feels-like |
9.9 °C |
|
4.8 °C |
15.7 °C, 2025 |
3.9 °C, 2019 |
| Air-frost Hrs |
0 hrs |
|
0.1 hrs |
0 hrs, 2009 |
0 hrs, 2009 |
| Measure | Value (anomaly) |
Month cumul. | Record High | Record Low |
| Temperature Range |
8.5 °C (+3.5) |
6.1 °C (+1.0) |
8.5 °C (+3.5), 2016 |
1.1 °C (-3.9), 2025 |
| Humidity Range |
2% |
13% |
26%, 2013 |
2%, 2016 |
| Pressure Range |
5 hPa |
7 hPa |
17 hPa, 2009 |
2 hPa, 2024 |
| Measure | Value [% of max] |
Month cumul. | Record High | Record Low |
| Sun Hours |
0 [0%] | 42 hrs (103%) [37%] |
7.5 [94%], 2018 |
0 [0%], 2010 |
| Wet Hours |
1
[Mean rain rate: 0.9 mm/h] | 34 hrs (116%) [10%] |
12, 2025 |
0, 2011 |
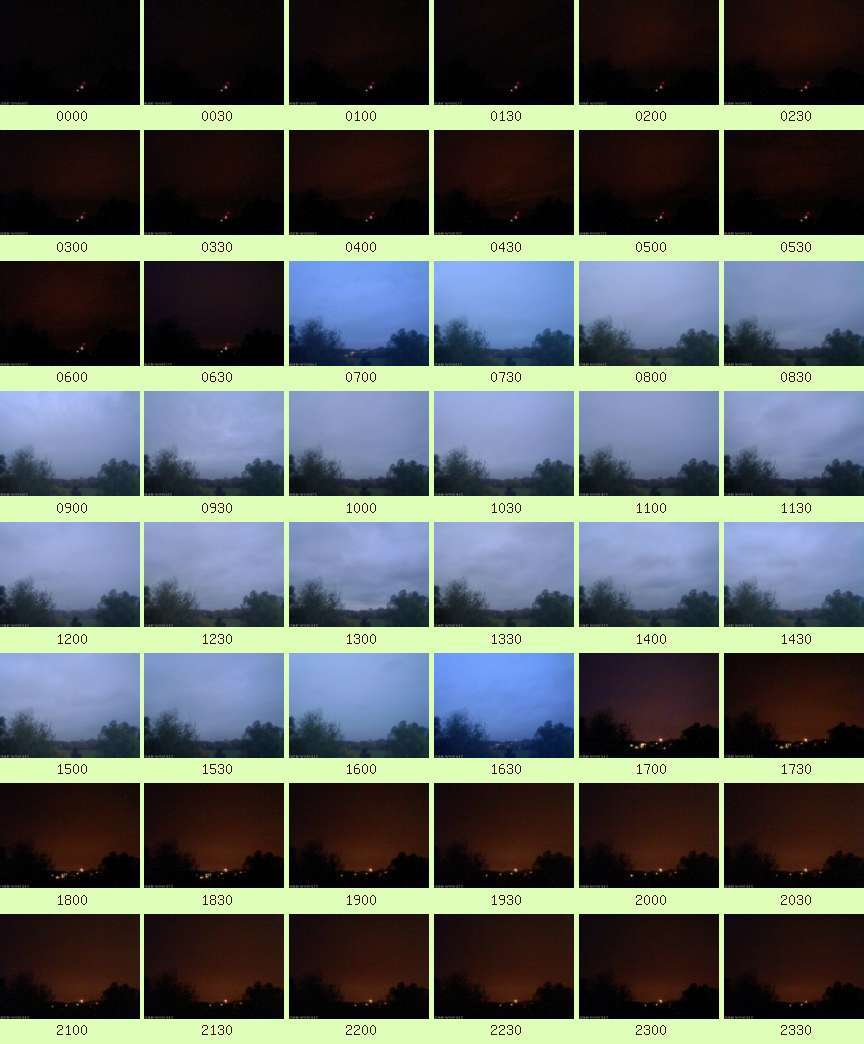
| Cloud Cover |
Overcast |
| Events |
None |
| Comments |
12 Rain |
| Extra Comments |
Interesting: At no point was the temperature lower than that of any previous minute in the day; a max -ve temp change of 0 for both 10m and 1hr |
| Issues |
None known |
| Observer Absent? |
Yes - observations may be unreliable |
| Pond Temperature @ Hampstead Heath |
0.0 °C |


 Large resolution version