| Measure | Value (anomaly) | Time |
Month cumul. | Record High | Record Low |
| Minimum Temperature |
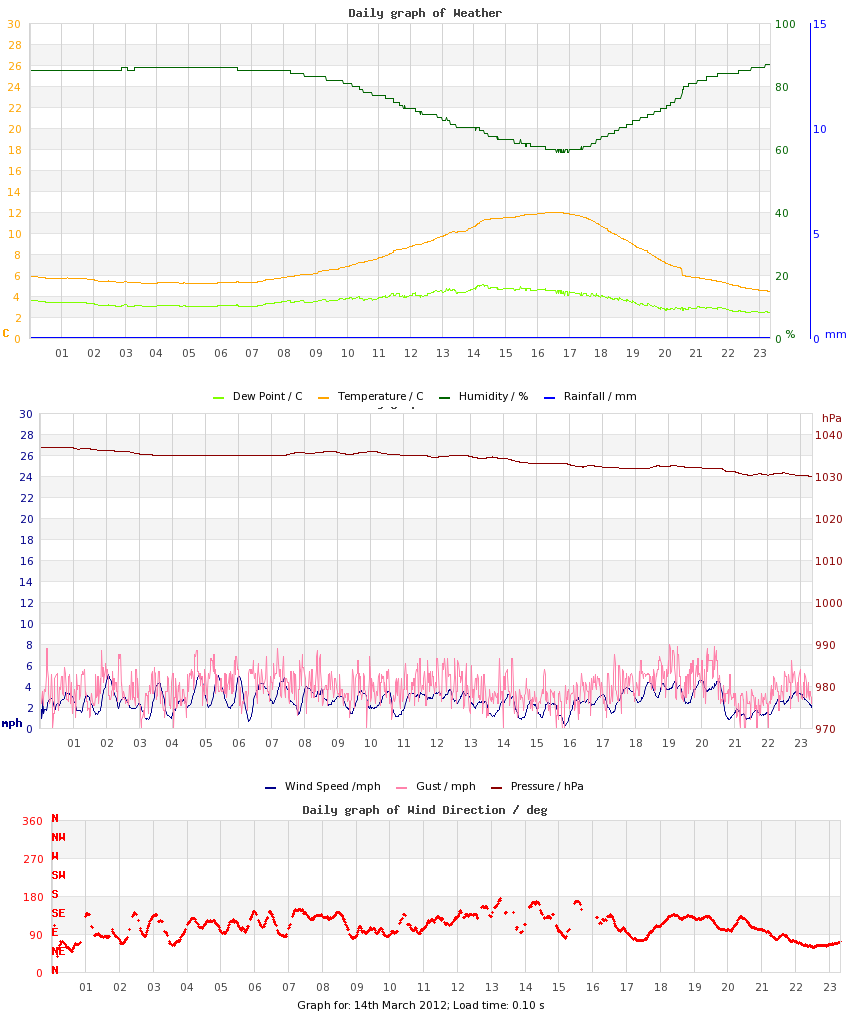
4.4 °C (+0.1) |
23:57 |
4.9 °C (+1.1) |
8.9 °C (+4.6), 2024 |
-1.7 °C (-6.0), 2013 |
| Maximum Temperature |
12.0 °C (+1.2) |
16:31 |
11.4 °C (+1.2) |
16.6 °C (+5.8), 2024 |
6.1 °C (-4.7), 2013 |
| Mean Temperature |
7.4 °C (+0.7) |
|
8.0 °C (+1.1) |
12.0 °C, 2024 |
2.7 °C, 2013 |
| Minimum Humidity |
59% |
16:46 |
62% |
71%, 2020 |
30%, 2016 |
| Maximum Humidity |
87% |
23:59 |
91% |
95%, 2009 |
78%, 2015 |
| Mean Humidity |
77% |
|
78% |
86%, 2024 |
63%, 2016 |
| Minimum Pressure |
1028 hPa |
22:37 |
1025 hPa |
1031 hPa, 2017 |
988 hPa, 2023 |
| Maximum Pressure |
1034 hPa |
00:43 |
1030 hPa |
1034 hPa, 2012 |
1011 hPa, 2018 |
| Mean Pressure |
1031 hPa |
|
1028 hPa |
1032 hPa, 2017 |
1003 hPa, 2018 |
| Mean Wind Speed |
3.0 mph (-2.2) |
|
4.6 mph (-0.6) |
9.6 mph, 2019 |
2.4 mph, 2009 |
| Maximum Wind Speed |
6.9 mph |
|
11.3 mph |
22.1 mph, 2019 |
6.9 mph, 2012 |
| Maximum Gust |
9.2 mph |
19:00 |
16.6 mph |
40.3 mph, 2019 |
9.2 mph, 2012 |
| Mean Wind Direction |
ESE |
|
|
|
|
| Rainfall |
0.0 mm |
|
16.8 mm (95%) |
4.0 mm, 2019 |
|
| Maximum Hourly Rain |
n/a |
|
|
1.7, 2020 |
|
| Maximum 10-min Rain |
n/a |
|
|
1.2, 2023 |
|
| Maximum Rain Rate |
n/a |
|
|
30, 2023 |
|
| Minimum Dew Point |
2.4 °C |
23:36 |
1.4 °C |
7.5 °C, 2024 |
-6.7 °C, 2016 |
| Maximum Dew Point |
5.1 °C |
14:16 |
6.7 °C |
11.6 °C, 2024 |
-0.2 °C, 2013 |
| Mean Dew Point |
3.6 °C |
|
4.2 °C |
9.7 °C, 2024 |
-3.5 °C, 2013 |
| Measure | Value | Time |
Month cumul. | Record High | Record Low |
| Night Minimum (21-09) |
* 5.2 °C * |
05:00 |
5.5 °C |
8.9 °C, 2024 |
-1.7 °C, 2013 |
| Day Maximum (09-21) |
12.0 °C |
16:31 |
11.4 °C |
16.6 °C, 2024 |
6.1 °C, 2013 |
| Max 10m Temp Rise |
0.5 °C |
14:11 |
0.5 °C |
1.3 °C, 2025 |
0.4 °C, 2010 |
| Max 1hr Temp Rise |
1.3 °C |
13:18 |
1.6 °C |
3.8 °C, 2014 |
1.3 °C, 2012 |
| Max 1hr Hum Rise |
9% |
21:15 |
6% |
15%, 2023 |
4%, 2013 |
| Max 10m Temp Fall |
0.7 °C |
21:13 |
0.5 °C |
1.4 °C, 2023 |
0.2 °C, 2017 |
| Max 1hr Temp Fall |
2.0 °C |
21:13 |
1.8 °C |
3.2 °C, 2023 |
0.7 °C, 2013 |
| Max 1hr Hum Fall |
5% |
10:47 |
10% |
22%, 2015 |
5%, 2012 |
| Max 10m Wind Speed |
5.1 mph |
02:04 |
8.2 mph |
16.5 mph, 2019 |
5.1 mph, 2012 |
| Minimum Feels-like |
2.2 °C |
23:22 |
2.3 °C |
5.9 °C, 2024 |
-6.1 °C, 2013 |
| Maximum Feels-like |
12.0 °C |
16:14 |
11.6 °C |
18.3 °C, 2024 |
6.0 °C, 2013 |
| Mean Feels-like |
6.6 °C |
|
6.8 °C |
12.5 °C, 2024 |
0.6 °C, 2013 |
| Air-frost Hrs |
0 hrs |
|
0 hrs |
8 hrs, 2013 |
0 hrs, 2009 |
| Measure | Value (anomaly) |
Month cumul. | Record High | Record Low |
| Temperature Range |
7.6 °C (+1.1) |
6.5 °C (+0.1) |
13.2 °C (+6.7), 2014 |
5.4 °C (-1.1), 2021 |
| Humidity Range |
28% |
28% |
57%, 2016 |
18%, 2017 |
| Pressure Range |
6 hPa |
6 hPa |
28 hPa, 2023 |
2 hPa, 2010 |
| Measure | Value [% of max] |
Month cumul. | Record High | Record Low |
| Sun Hours |
6 [57%] | 54 hrs (109%) [37%] |
9.5 [90%], 2014 |
0 [0%], 2026 |
| Wet Hours |
0 | 20 hrs (85%) [6%] |
6, 2019 |
, 2009 |
| Cloud Cover |
am: Overcast transitioned to Mostly Cloudy
pm: Sunny or Hazy |
| Events |
None |
| Comments |
- |
| Extra Comments |
|
| Issues |
Data Loss (2034-2112) - due to software crash |
| Observer Absent? |
Yes - observations may be unreliable |
| Pond Temperature @ Hampstead Heath |
0.0 °C |