| Measure | Value (anomaly) | Time |
Month cumul. | Record High | Record Low |
| Minimum Temperature |
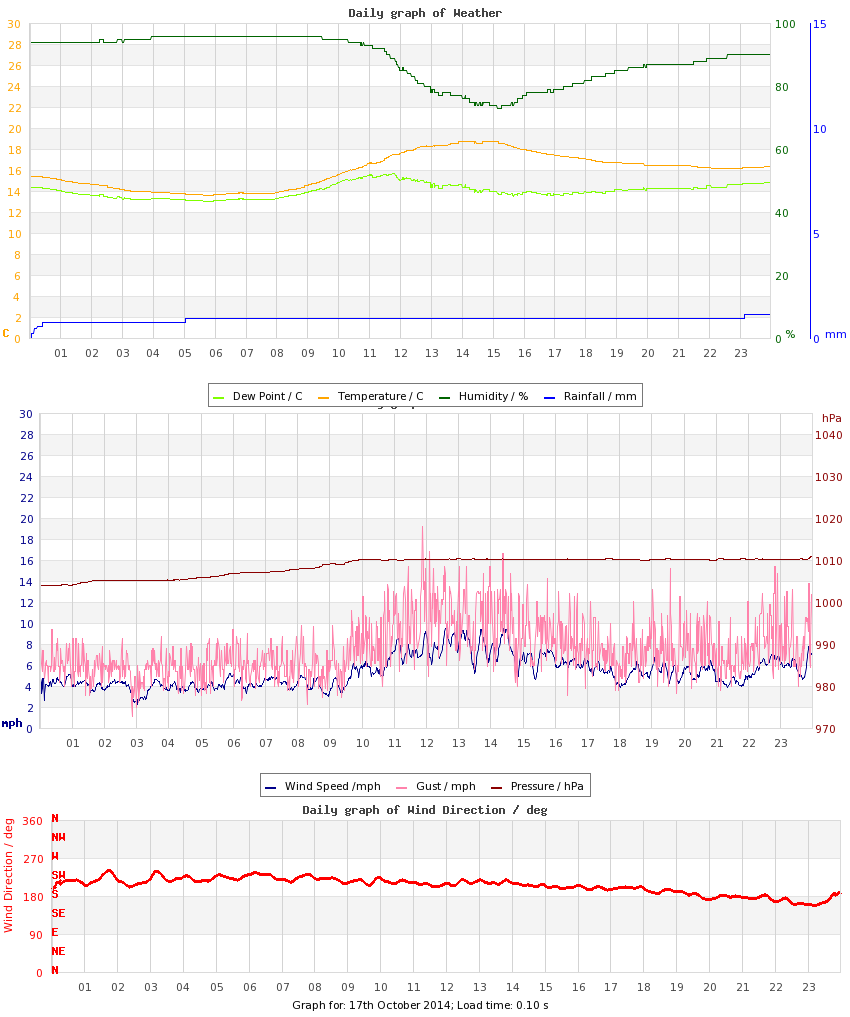
13.6 °C (+5.0) |
05:46 |
10.1 °C (+0.8) |
13.6 °C (+5.0), 2014 |
3.5 °C (-5.1), 2010 |
| Maximum Temperature |
18.7 °C (+4.0) |
14:31 |
16.5 °C (+0.9) |
18.7 °C (+4.0), 2014 |
12.0 °C (-2.7), 2010 |
| Mean Temperature |
16.0 °C (+4.5) |
|
13.4 °C (+0.8) |
16.0 °C, 2014 |
7.6 °C, 2010 |
| Minimum Humidity |
73% |
15:12 |
68% |
83%, 2018 |
49%, 2010 |
| Maximum Humidity |
96% |
06:41 |
96% |
96%, 2012 |
84%, 2010 |
| Mean Humidity |
89% |
|
85% |
90%, 2018 |
68%, 2010 |
| Minimum Pressure |
1004 hPa |
00:30 |
1005 hPa |
1028 hPa, 2009 |
993 hPa, 2012 |
| Maximum Pressure |
1011 hPa |
16:43 |
1013 hPa |
1033 hPa, 2009 |
1003 hPa, 2012 |
| Mean Pressure |
1009 hPa |
|
1009 hPa |
1030 hPa, 2009 |
997 hPa, 2012 |
| Mean Wind Speed |
5.3 mph (+1.2) |
|
4.0 mph (-0.1) |
7.6 mph, 2023 |
1.2 mph, 2020 |
| Maximum Wind Speed |
13.0 mph |
14:23 |
12.2 mph |
18.5 mph, 2012 |
6.1 mph, 2025 |
| Maximum Gust |
19.2 mph |
11:52 |
17.5 mph |
29.7 mph, 2011 |
9.2 mph, 2025 |
| Mean Wind Direction |
SSW |
|
|
|
|
| Rainfall |
1.1 mm |
|
84.7 mm (238%) |
9.5 mm, 2012 |
|
| Maximum Hourly Rain |
0.7 mm |
01:01 |
|
4.0 mm, 2012 |
|
| Maximum 10-min Rain |
0.4 mm |
00:10 |
|
1.7 mm, 2012 |
|
| Maximum Rain Rate |
2.2 mm/h |
00:08 |
|
30 mm/h, 2012 |
|
| Minimum Dew Point |
13.0 °C |
05:46 |
8.1 °C |
13.0 °C, 2014 |
0.0 °C, 2010 |
| Maximum Dew Point |
15.7 °C |
11:46 |
13.3 °C |
15.8 °C, 2024 |
5.0 °C, 2009 |
| Mean Dew Point |
14.1 °C |
|
10.8 °C |
14.1 °C, 2014 |
1.9 °C, 2010 |
| Measure | Value | Time |
Month cumul. | Record High | Record Low |
| Night Minimum (21-09) |
13.6 °C |
05:46 |
10.5 °C |
14.7 °C, 2022 |
5.5 °C, 2010 |
| Day Maximum (09-21) |
18.7 °C |
14:31 |
16.5 °C |
18.7 °C, 2014 |
12.0 °C, 2010 |
| Max 10m Temp Rise |
0.4 °C |
11:29 |
0.5 °C |
0.7 °C, 2010 |
0.2 °C, 2018 |
| Max 1hr Temp Rise |
1.3 °C |
10:22 |
1.7 °C |
3.4 °C, 2011 |
0.7 °C, 2018 |
| Max 1hr Hum Rise |
5% |
16:08 |
8% |
16%, 2012 |
2%, 2025 |
| Max 10m Temp Fall |
0.2 °C |
15:28 |
0.4 °C |
1.0 °C, 2012 |
0.2 °C, 2014 |
| Max 1hr Temp Fall |
0.8 °C |
16:05 |
1.5 °C |
2.7 °C, 2010 |
0.5 °C, 2025 |
| Max 1hr Hum Fall |
9% |
12:21 |
10% |
14%, 2019 |
3%, 2018 |
| Max 10m Wind Speed |
9.5 mph |
12:36 |
9.1 mph |
14.2 mph, 2017 |
3.0 mph, 2020 |
| Minimum Feels-like |
16.4 °C |
05:37 |
10.5 °C |
16.4 °C, 2014 |
0.0 °C, 2009 |
| Maximum Feels-like |
22.4 °C |
13:53 |
19.0 °C |
22.4 °C, 2014 |
0.0 °C, 2009 |
| Mean Feels-like |
19.4 °C |
|
15.2 °C |
19.4 °C, 2014 |
0.0 °C, 2009 |
| Air-frost Hrs |
0 hrs |
|
0 hrs |
0 hrs, 2009 |
0 hrs, 2009 |
| Minimum PM2.5 |
0 |
|
0 |
0, 2009 |
0, 2021 |
| Maximum PM2.5 |
n/a |
|
0 |
n/a |
n/a |
| Mean PM2.5 |
n/a |
|
0 |
n/a |
n/a |
| Measure | Value (anomaly) |
Month cumul. | Record High | Record Low |
| Temperature Range |
5.1 °C (-1.1) |
6.5 °C (+0.1) |
8.5 °C (+2.3), 2010 |
2.6 °C (-3.5), 2015 |
| Humidity Range |
23% |
27% |
40%, 2012 |
12%, 2018 |
| Pressure Range |
7 hPa |
8 hPa |
16 hPa, 2022 |
2 hPa, 2025 |
| Measure | Value [% of max] |
Month cumul. | Record High | Record Low |
| Sun Hours |
3 [32%] | 61 hrs (90%) [36%] |
6 [63%], 2010 |
0 [0%], 2018 |
| Wet Hours |
2
[Mean rain rate: 0.6 mm/h] | 55 hrs (205%) [14%] |
5, 2012 |
0, 2009 |
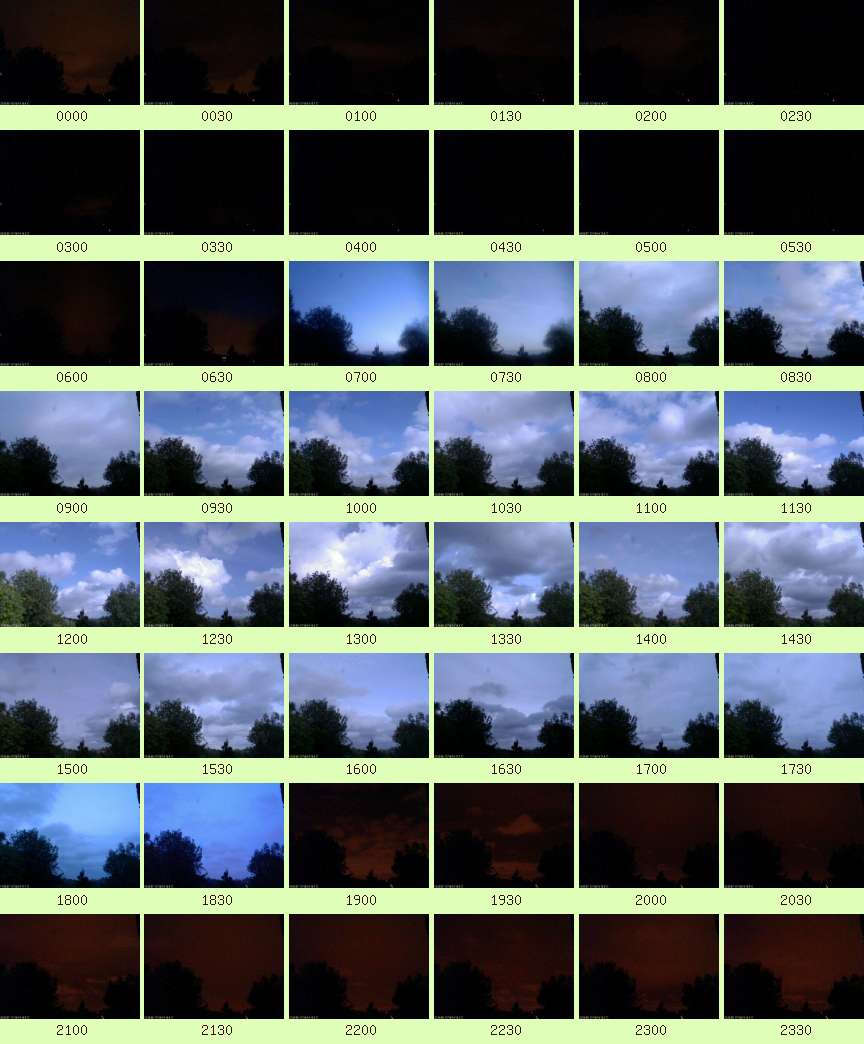
| Cloud Cover |
Mostly Cloudy with periods of Partly Cloudy |
| Events |
None |
| Comments |
00 Shower; 21- brief Rain spells |
| Extra Comments |
|
| Issues |
None known |
| Observer Absent? |
No |
| Pond Temperature @ Hampstead Heath |
0.0 °C |


 Large resolution version