| Measure | Value (anomaly) | Time |
Month cumul. | Record High | Record Low |
| Minimum Temperature |
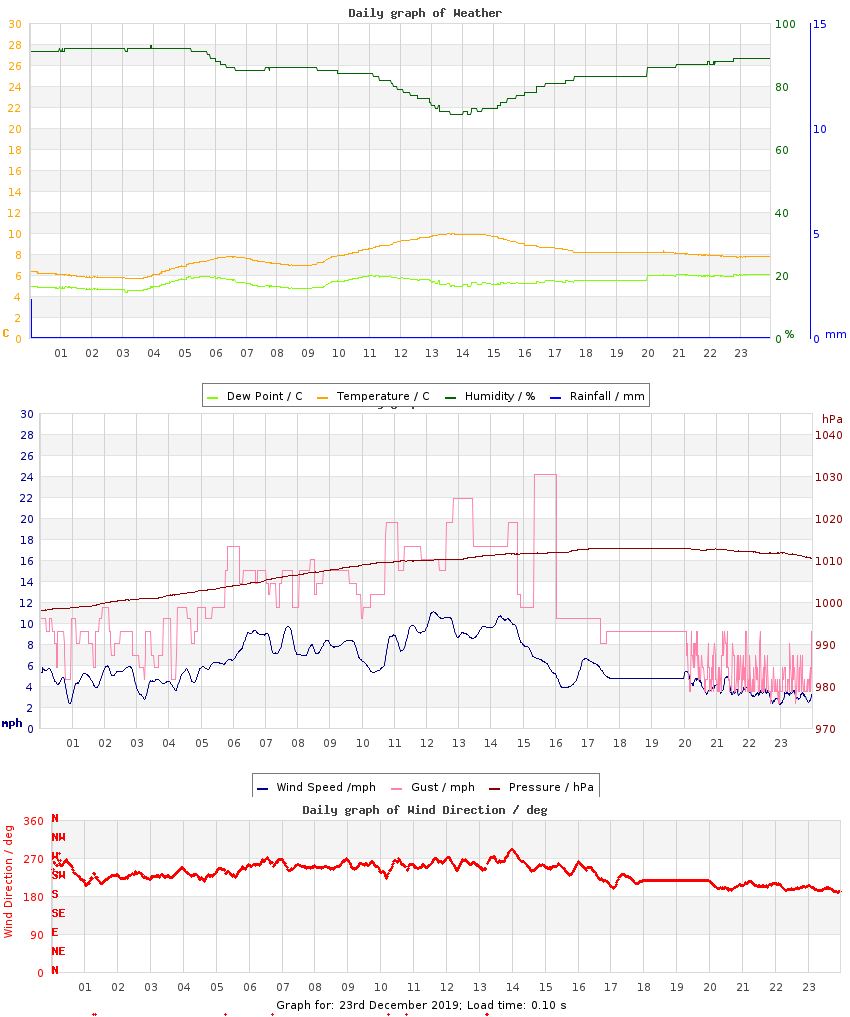
5.7 °C (+2.3) |
03:22 |
4.1 °C (+0.4) |
10.8 °C (+7.4), 2014 |
-3.9 °C (-7.3), 2009 |
| Maximum Temperature |
10.0 °C (+2.3) |
13:33 |
9.3 °C (+1.0) |
12.9 °C (+5.2), 2012 |
1.9 °C (-5.8), 2010 |
| Mean Temperature |
7.8 °C (+2.3) |
|
6.9 °C (+0.7) |
11.7 °C, 2014 |
-0.5 °C, 2009 |
| Minimum Humidity |
71% |
13:48 |
78% |
98%, 2009 |
63%, 2015 |
| Maximum Humidity |
93% |
03:55 |
94% |
98%, 2009 |
76%, 2014 |
| Mean Humidity |
85% |
|
87% |
98%, 2009 |
72%, 2014 |
| Minimum Pressure |
998 hPa |
00:00 |
997 hPa |
1030 hPa, 2017 |
978 hPa, 2013 |
| Maximum Pressure |
1013 hPa |
18:51 |
1010 hPa |
1037 hPa, 2017 |
991 hPa, 2009 |
| Mean Pressure |
1008 hPa |
|
1004 hPa |
1033 hPa, 2017 |
990 hPa, 2009 |
| Mean Wind Speed |
6.1 mph (+1.0) |
|
6.1 mph (+1.0) |
12.1 mph, 2013 |
1.5 mph, 2009 |
| Maximum Wind Speed |
11.2 mph |
12:05 |
15.2 mph |
31.7 mph, 2013 |
8.1 mph, 2009 |
| Maximum Gust |
24.2 mph |
15:21 |
25.0 mph |
47.6 mph, 2013 |
13.8 mph, 2009 |
| Mean Wind Direction |
SW |
|
|
|
|
| Rainfall |
0.0 mm |
|
86.0 mm (203%) |
15.2 mm, 2013 |
|
| Maximum Hourly Rain |
n/a |
|
|
6.3, 2022 |
|
| Maximum 10-min Rain |
n/a |
|
|
2, 2022 |
|
| Maximum Rain Rate |
n/a |
|
|
20, 2011 |
|
| Minimum Dew Point |
4.3 °C |
03:06 |
2.2 °C |
7.3 °C, 2022 |
-4.8 °C, 2010 |
| Maximum Dew Point |
6.1 °C |
23:33 |
7.1 °C |
12.6 °C, 2012 |
-1.9 °C, 2010 |
| Mean Dew Point |
5.4 °C |
|
4.8 °C |
9.8 °C, 2020 |
-3.0 °C, 2010 |
| Measure | Value | Time |
Month cumul. | Record High | Record Low |
| Night Minimum (21-09) |
5.7 °C |
03:20 |
4.8 °C |
11.8 °C, 2012 |
-3.9 °C, 2009 |
| Day Maximum (09-21) |
10.0 °C |
13:37 |
9.1 °C |
12.8 °C, 2014 |
1.9 °C, 2010 |
| Max 10m Temp Rise |
0.4 °C |
09:40 |
0.3 °C |
0.5 °C, 2022 |
0.1 °C, 2011 |
| Max 1hr Temp Rise |
1.0 °C |
04:54 |
1.2 °C |
1.8 °C, 2022 |
0.3 °C, 2012 |
| Max 1hr Hum Rise |
5% |
16:01 |
5% |
9%, 2011 |
0%, 2009 |
| Max 10m Temp Fall |
0.2 °C |
14:56 |
0.4 °C |
1.4 °C, 2018 |
0.1 °C, 2012 |
| Max 1hr Temp Fall |
0.9 °C |
16:01 |
1.3 °C |
4.2 °C, 2018 |
0.3 °C, 2013 |
| Max 1hr Hum Fall |
6% |
06:39 |
6% |
8%, 2014 |
0%, 2009 |
| Max 10m Wind Speed |
11.1 mph |
12:13 |
11.7 mph |
23.2 mph, 2013 |
7.2 mph, 2009 |
| Minimum Feels-like |
2.3 °C |
01:57 |
-0.1 °C |
10.8 °C, 2014 |
-6.8 °C, 2010 |
| Maximum Feels-like |
10.0 °C |
13:31 |
9.0 °C |
15.5 °C, 2012 |
-1.0 °C, 2010 |
| Mean Feels-like |
5.0 °C |
|
4.8 °C |
12.4 °C, 2012 |
-3.5 °C, 2010 |
| Air-frost Hrs |
0 hrs |
|
0 hrs |
13 hrs, 2009 |
0 hrs, 2011 |
| Measure | Value (anomaly) |
Month cumul. | Record High | Record Low |
| Temperature Range |
4.3 °C (-0.0) |
5.2 °C (+0.6) |
7.7 °C (+3.4), 2009 |
2.0 °C (-2.3), 2014 |
| Humidity Range |
22% |
16% |
28%, 2024 |
0%, 2009 |
| Pressure Range |
15 hPa |
13 hPa |
34 hPa, 2013 |
2 hPa, 2009 |
| Measure | Value [% of max] |
Month cumul. | Record High | Record Low |
| Sun Hours |
4.3 [62%] | 60 hrs (124%) [37%] |
5.3 [76%], 2015 |
0 [0%], 2010 |
| Wet Hours |
0 | 96 hrs (209%) [17%] |
13, 2013 |
0, 2010 |
| Cloud Cover |
am: Sunny
pm: Partly Cloudy |
| Events |
None |
| Comments |
- |
| Extra Comments |
|
| Issues |
server CPU pegged til 20 -some data issues |
| Observer Absent? |
Yes - observations may be unreliable |
| Pond Temperature @ Hampstead Heath |
5.0 °C |


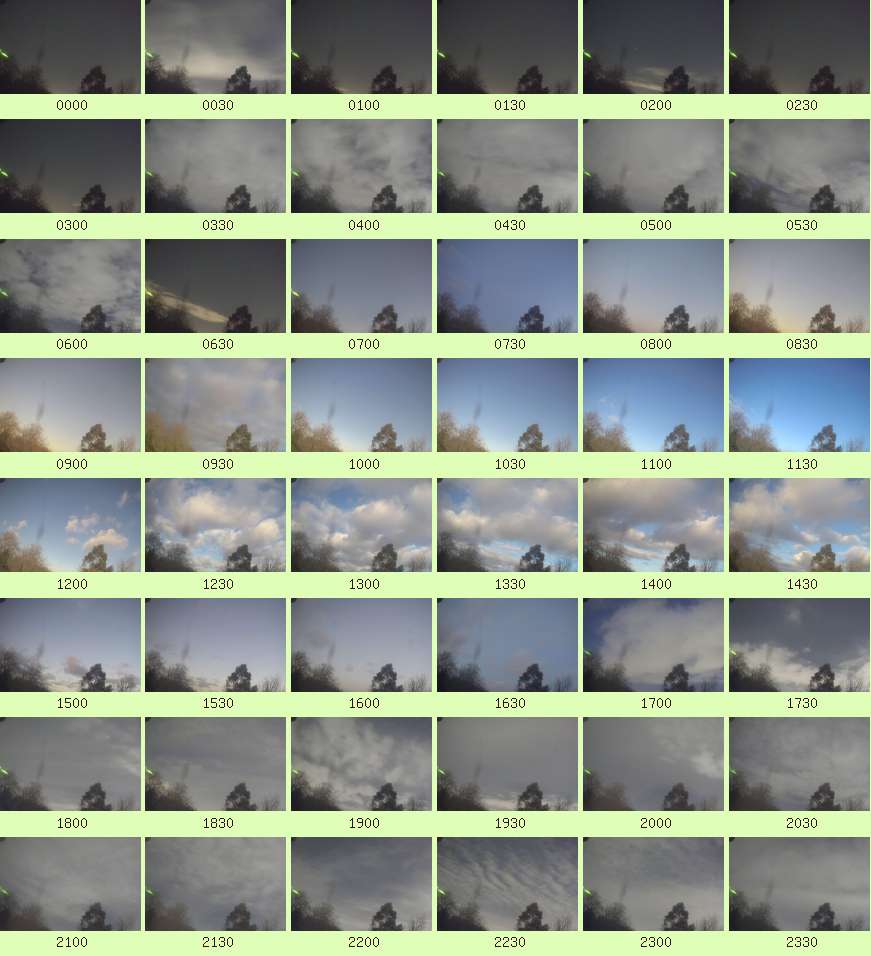 Full resolution individual images at up-to 5 minute intervals