| Measure | Value (anomaly) | Time |
Month cumul. | Record High | Record Low |
| Minimum Temperature |
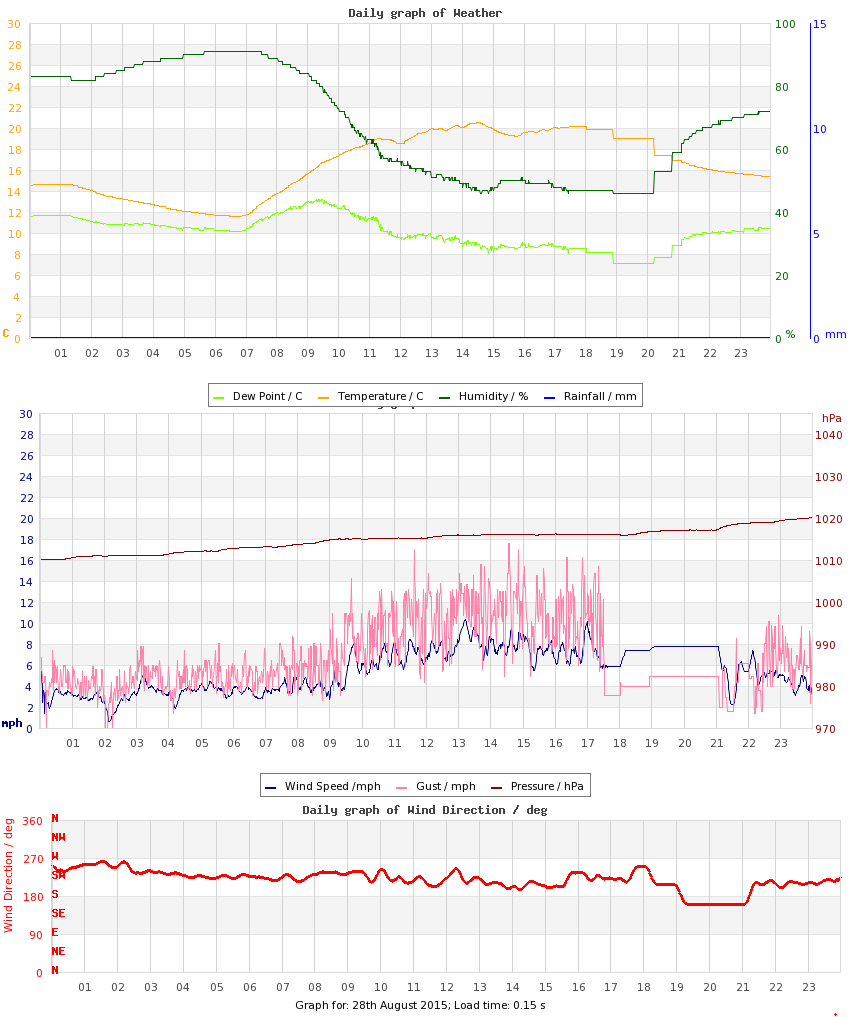
11.6 °C (-1.7) |
06:39 |
13.8 °C (-0.3) |
17.9 °C (+4.6), 2019 |
10.7 °C (-2.6), 2023 |
| Maximum Temperature |
20.6 °C (-1.0) |
14:31 |
21.8 °C (-0.7) |
28.2 °C (+6.6), 2024 |
18.3 °C (-3.3), 2020 |
| Mean Temperature |
16.5 °C (-1.4) |
|
17.9 °C (-0.5) |
22.0 °C, 2017 |
14.7 °C, 2020 |
| Minimum Humidity |
46% |
17:23 |
50% |
71%, 2016 |
39%, 2013 |
| Maximum Humidity |
91% |
06:34 |
86% |
94%, 2014 |
84%, 2009 |
| Mean Humidity |
68% |
|
70% |
85%, 2020 |
61%, 2017 |
| Minimum Pressure |
1010 hPa |
00:22 |
1011 hPa |
1026 hPa, 2021 |
1000 hPa, 2020 |
| Maximum Pressure |
1020 hPa |
23:54 |
1017 hPa |
1028 hPa, 2021 |
1004 hPa, 2020 |
| Mean Pressure |
1015 hPa |
|
1013 hPa |
1027 hPa, 2021 |
1002 hPa, 2020 |
| Mean Wind Speed |
5.4 mph (+1.4) |
|
4.3 mph (+0.3) |
7.6 mph, 2009 |
1.7 mph, 2013 |
| Maximum Wind Speed |
12.8 mph |
13:25 |
12.1 mph |
18.4 mph, 2009 |
5.9 mph, 2013 |
| Maximum Gust |
17.6 mph |
14:33 |
17.1 mph |
27.6 mph, 2009 |
7.6 mph, 2013 |
| Mean Wind Direction |
SW |
|
|
|
|
| Rainfall |
0.0 mm |
|
57.2 mm (117%) |
2.8 mm, 2020 |
|
| Maximum Hourly Rain |
n/a |
|
|
2, 2020 |
|
| Maximum 10-min Rain |
n/a |
|
|
1.4, 2009 |
|
| Maximum Rain Rate |
n/a |
|
|
24, 2014 |
|
| Minimum Dew Point |
7.1 °C |
19:32 |
8.9 °C |
14.2 °C, 2016 |
6.5 °C, 2010 |
| Maximum Dew Point |
13.2 °C |
09:22 |
14.6 °C |
18.3 °C, 2024 |
11.0 °C, 2010 |
| Mean Dew Point |
10.1 °C |
|
11.8 °C |
15.4 °C, 2016 |
8.9 °C, 2010 |
| Measure | Value | Time |
Month cumul. | Record High | Record Low |
| Night Minimum (21-09) |
11.6 °C |
06:39 |
14.1 °C |
18.8 °C, 2019 |
10.7 °C, 2023 |
| Day Maximum (09-21) |
20.6 °C |
14:31 |
21.8 °C |
28.2 °C, 2024 |
18.3 °C, 2020 |
| Max 10m Temp Rise |
0.5 °C |
07:15 |
0.6 °C |
0.9 °C, 2024 |
0.3 °C, 2018 |
| Max 1hr Temp Rise |
2.1 °C |
07:59 |
2.1 °C |
3.5 °C, 2024 |
1.3 °C, 2014 |
| Max 1hr Hum Rise |
14% |
21:11 |
9% |
14%, 2011 |
4%, 2016 |
| Max 10m Temp Fall |
0.4 °C |
20:13 |
0.4 °C |
0.9 °C, 2021 |
0.4 °C, 2014 |
| Max 1hr Temp Fall |
1.5 °C |
21:07 |
1.6 °C |
2.6 °C, 2013 |
1.1 °C, 2016 |
| Max 1hr Hum Fall |
13% |
10:22 |
10% |
17%, 2017 |
6%, 2016 |
| Max 10m Wind Speed |
10.3 mph |
13:12 |
9.1 mph |
13.8 mph, 2016 |
4.2 mph, 2013 |
| Minimum Feels-like |
13.0 °C |
06:28 |
15.3 °C |
21.5 °C, 2019 |
11.5 °C, 2010 |
| Maximum Feels-like |
21.5 °C |
13:46 |
24.4 °C |
34.4 °C, 2024 |
19.7 °C, 2010 |
| Mean Feels-like |
17.8 °C |
|
20.2 °C |
25.1 °C, 2017 |
15.8 °C, 2010 |
| Air-frost Hrs |
0 hrs |
|
0 hrs |
0 hrs, 2009 |
0 hrs, 2009 |
| Measure | Value (anomaly) |
Month cumul. | Record High | Record Low |
| Temperature Range |
9.0 °C (+0.7) |
8.0 °C (-0.4) |
14.6 °C (+6.2), 2024 |
3.3 °C (-5.1), 2016 |
| Humidity Range |
45% |
36% |
54%, 2013 |
13%, 2016 |
| Pressure Range |
10 hPa |
6 hPa |
10 hPa, 2015 |
2 hPa, 2021 |
| Measure | Value [% of max] |
Month cumul. | Record High | Record Low |
| Sun Hours |
9 [71%] | 116 hrs (69%) [31%] |
11 [87%], 2017 |
1 [8%], 2016 |
| Wet Hours |
0 | 50 hrs (145%) [7.4%] |
3, 2014 |
0, 2011 |
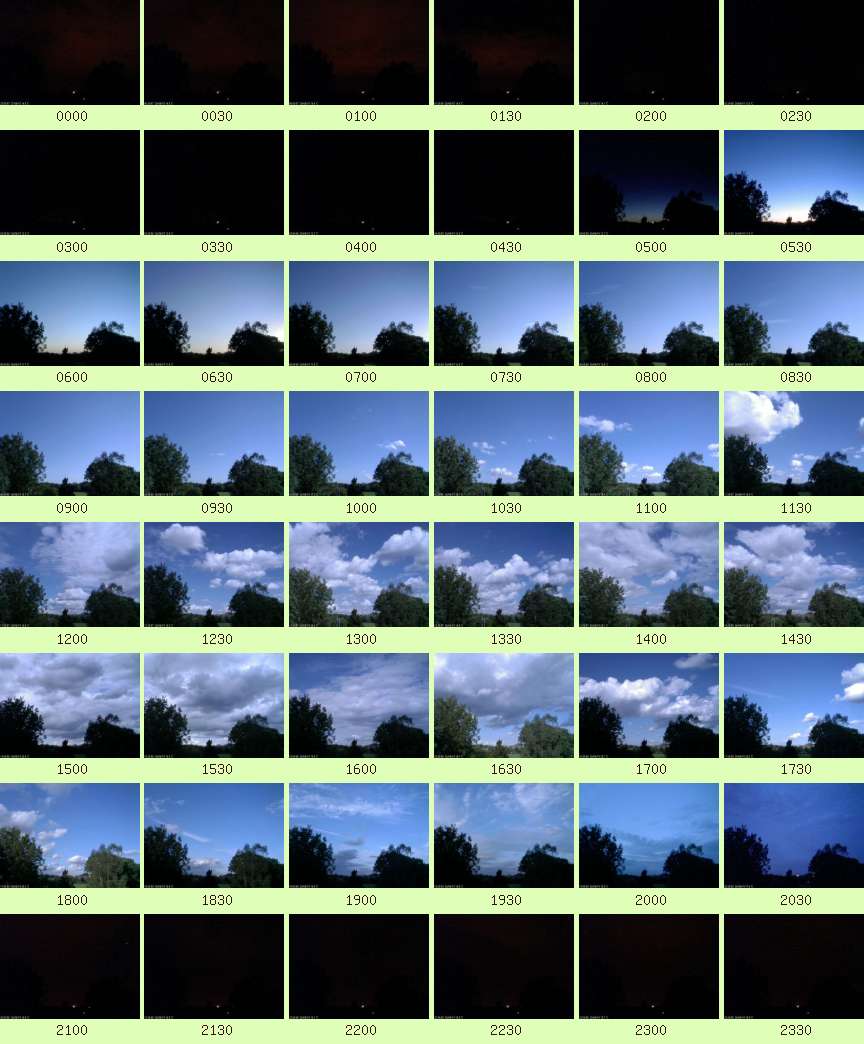
| Cloud Cover |
am: Sunny transitioned to Mostly Sunny
pm: Partly Cloudy |
| Events |
None |
| Comments |
- |
| Extra Comments |
|
| Issues |
1730-2130 data loss, unreconstructed |
| Observer Absent? |
No |
| Pond Temperature @ Hampstead Heath |
0.0 °C |


 Large resolution version
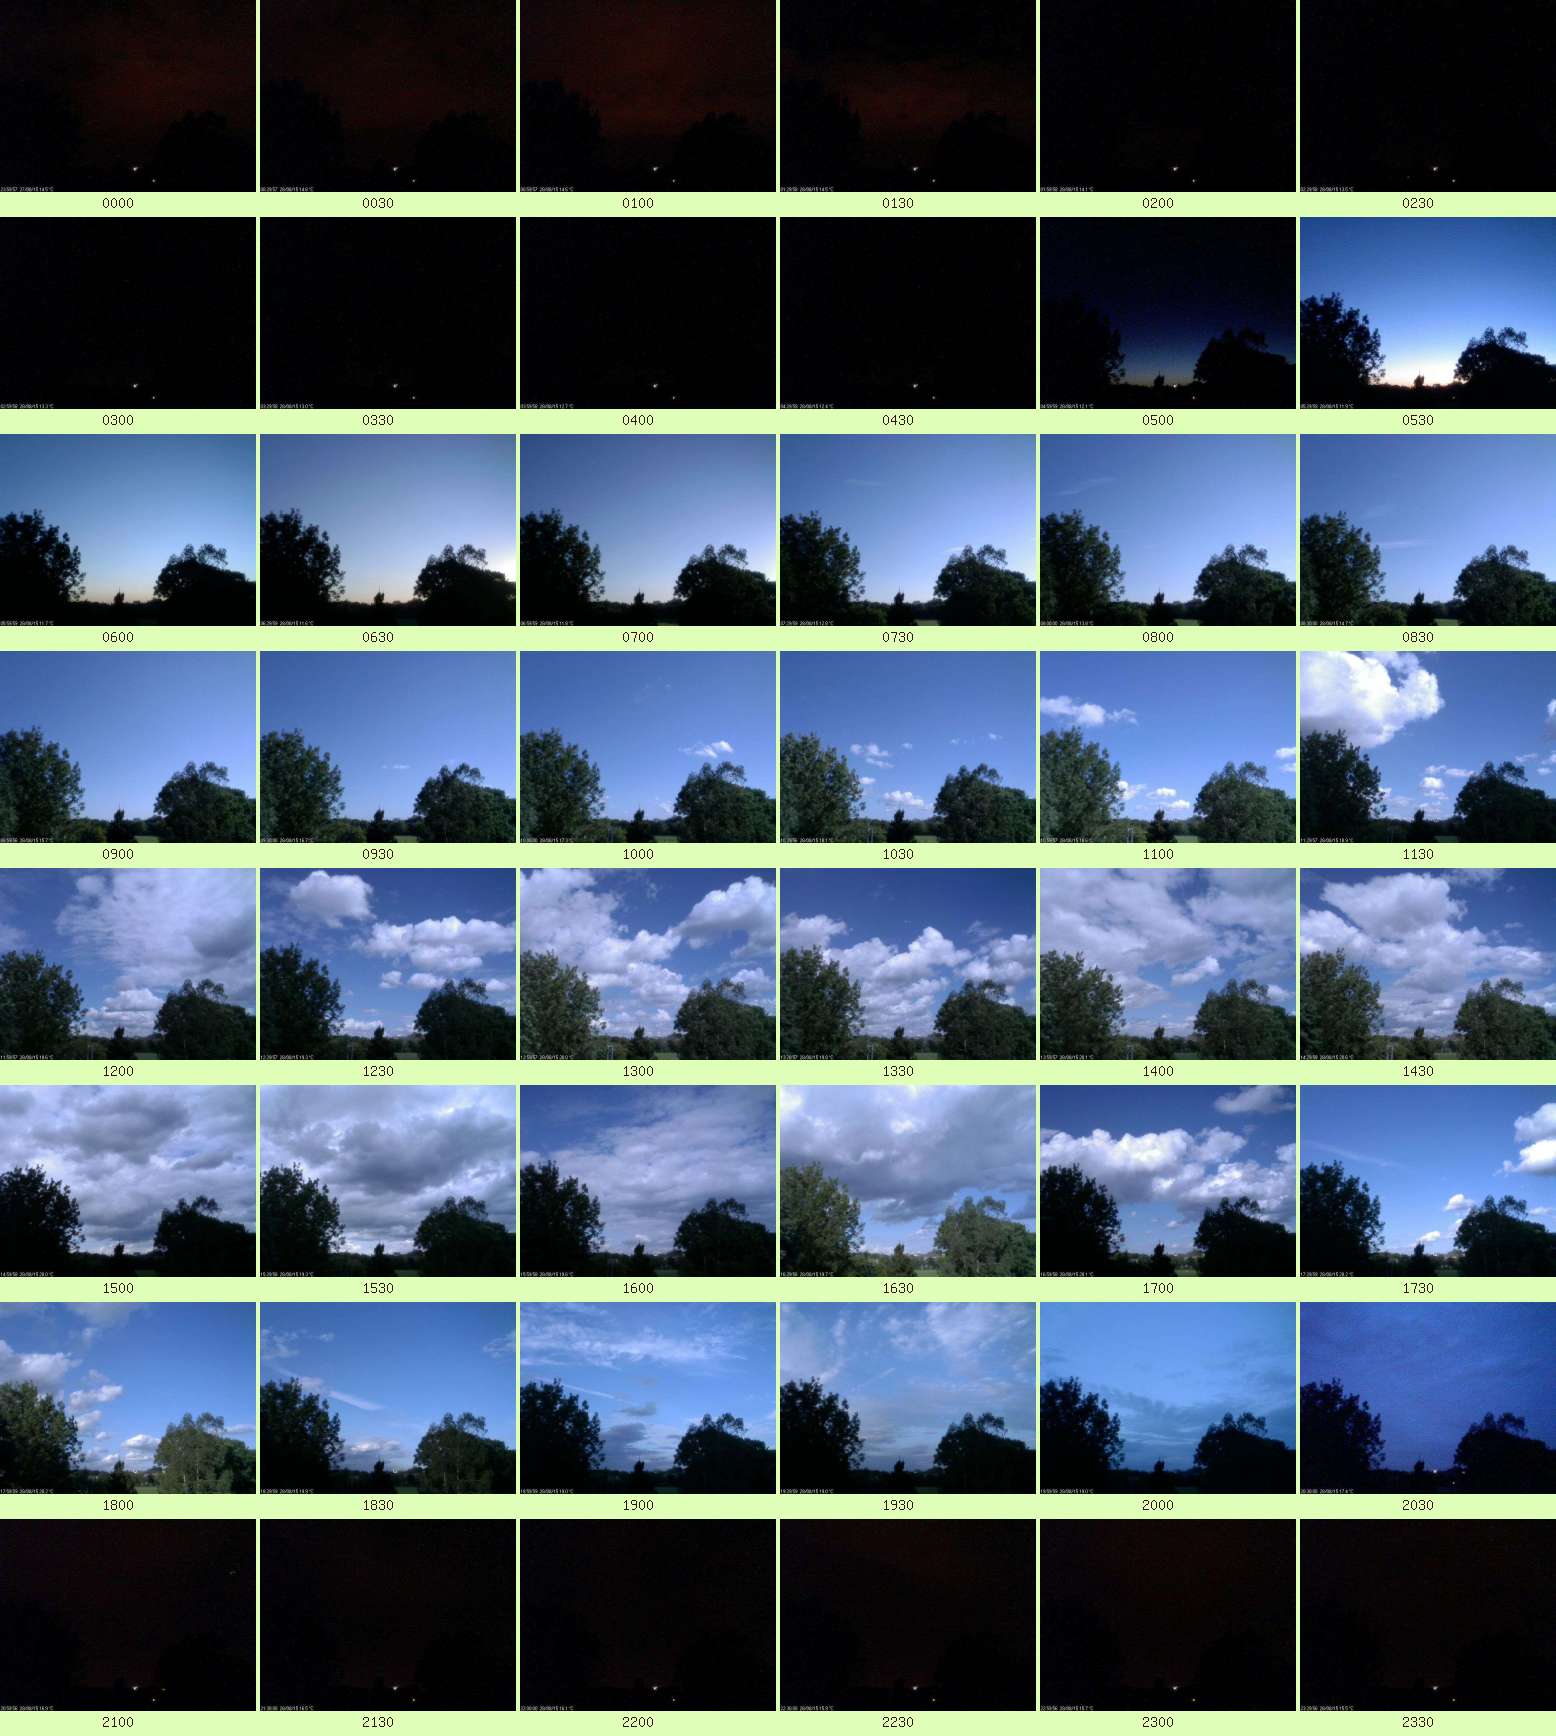