| Measure | Value (anomaly) | Time |
Month cumul. | Record High | Record Low |
| Minimum Temperature |
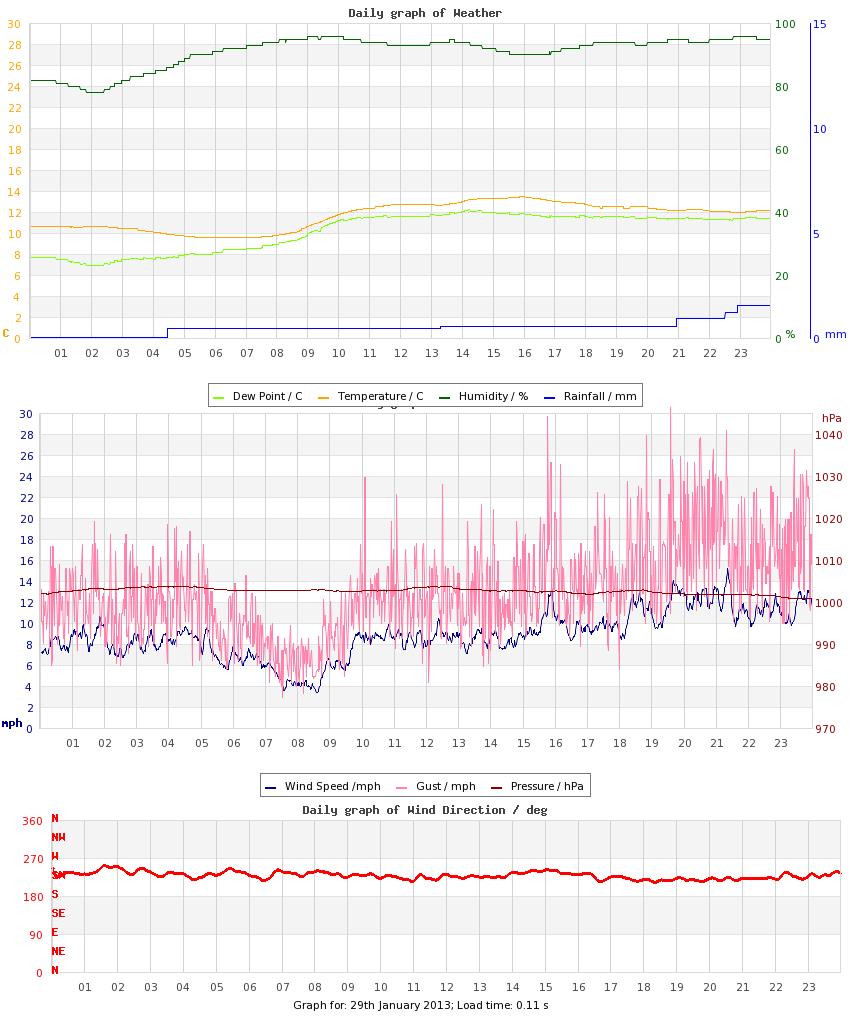
9.6 °C (+6.6) |
06:24 |
1.7 °C (-1.3) |
9.6 °C (+6.6), 2013 |
-0.8 °C (-3.8), 2019 |
| Maximum Temperature |
13.5 °C (+5.7) |
15:56 |
5.7 °C (-2.1) |
13.5 °C (+5.7), 2013 |
1.3 °C (-6.5), 2011 |
| Mean Temperature |
11.6 °C (+6.2) |
|
3.9 °C (-1.7) |
11.6 °C, 2013 |
0.7 °C, 2011 |
| Minimum Humidity |
78% |
02:06 |
78% |
91%, 2014 |
64%, 2015 |
| Maximum Humidity |
96% |
09:40 |
95% |
98%, 2010 |
77%, 2011 |
| Mean Humidity |
91% |
|
88% |
95%, 2014 |
74%, 2011 |
| Minimum Pressure |
1000 hPa |
23:22 |
1009 hPa |
1028 hPa, 2012 |
976 hPa, 2015 |
| Maximum Pressure |
1004 hPa |
07:00 |
1017 hPa |
1034 hPa, 2022 |
999 hPa, 2014 |
| Mean Pressure |
1003 hPa |
|
1013 hPa |
1030 hPa, 2012 |
985 hPa, 2015 |
| Mean Wind Speed |
8.9 mph (+3.7) |
|
4.7 mph (-0.5) |
12.0 mph, 2016 |
2.9 mph, 2012 |
| Maximum Wind Speed |
19.0 mph |
21:18 |
12.4 mph |
23.2 mph, 2016 |
8.5 mph, 2012 |
| Maximum Gust |
33.1 mph |
19:35 |
17.6 mph |
33.1 mph, 2013 |
10.5 mph, 2012 |
| Mean Wind Direction |
SW |
|
|
|
|
| Rainfall |
1.5 mm |
|
39.8 mm (72%) |
14.0 mm, 2017 |
|
| Maximum Hourly Rain |
0.6 mm |
22:55 |
|
4.3 mm, 2017 |
|
| Maximum 10-min Rain |
0.4 mm |
04:28 |
|
1.1 mm, 2017 |
|
| Maximum Rain Rate |
0.7 mm/h |
22:55 |
|
11 mm/h, 2017 |
|
| Minimum Dew Point |
6.9 °C |
02:06 |
-0.5 °C |
7.9 °C, 2024 |
-4.6 °C, 2010 |
| Maximum Dew Point |
12.3 °C |
14:13 |
4.2 °C |
12.3 °C, 2013 |
-2.8 °C, 2011 |
| Mean Dew Point |
10.2 °C |
|
1.9 °C |
10.2 °C, 2013 |
-3.3 °C, 2011 |
| Measure | Value | Time |
Month cumul. | Record High | Record Low |
| Night Minimum (21-09) |
9.6 °C |
06:24 |
2.3 °C |
10.4 °C, 2018 |
-0.8 °C, 2019 |
| Day Maximum (09-21) |
13.5 °C |
15:56 |
5.4 °C |
13.5 °C, 2013 |
1.3 °C, 2011 |
| Max 10m Temp Rise |
0.3 °C |
08:48 |
0.3 °C |
0.5 °C, 2017 |
0.1 °C, 2011 |
| Max 1hr Temp Rise |
1.3 °C |
09:43 |
0.9 °C |
1.9 °C, 2017 |
0.3 °C, 2014 |
| Max 1hr Hum Rise |
5% |
03:15 |
4% |
12%, 2015 |
1%, 2024 |
| Max 10m Temp Fall |
0.2 °C |
18:05 |
0.3 °C |
0.9 °C, 2015 |
0.1 °C, 2011 |
| Max 1hr Temp Fall |
0.5 °C |
04:26 |
0.9 °C |
2.9 °C, 2019 |
0.3 °C, 2011 |
| Max 1hr Hum Fall |
4% |
01:49 |
6% |
16%, 2022 |
1%, 2011 |
| Max 10m Wind Speed |
15.2 mph |
21:21 |
9.2 mph |
17.3 mph, 2016 |
6.4 mph, 2012 |
| Minimum Feels-like |
6.3 °C |
05:04 |
-1.8 °C |
7.1 °C, 2024 |
-6.0 °C, 2010 |
| Maximum Feels-like |
15.7 °C |
15:52 |
5.7 °C |
15.7 °C, 2013 |
1.2 °C, 2011 |
| Mean Feels-like |
12.6 °C |
|
2.0 °C |
12.6 °C, 2013 |
-2.8 °C, 2011 |
| Air-frost Hrs |
0 hrs |
|
5 hrs |
4 hrs, 2019 |
0 hrs, 2012 |
| Minimum PM2.5 |
0 |
|
0 |
0, 2009 |
0, 2012 |
| Maximum PM2.5 |
n/a |
|
0 |
n/a |
n/a |
| Mean PM2.5 |
n/a |
|
0 |
n/a |
n/a |
| Measure | Value (anomaly) |
Month cumul. | Record High | Record Low |
| Temperature Range |
3.9 °C (-0.8) |
4.0 °C (-0.8) |
9.2 °C (+4.5), 2018 |
1.4 °C (-3.3), 2011 |
| Humidity Range |
18% |
17% |
31%, 2010 |
4%, 2011 |
| Pressure Range |
4 hPa |
8 hPa |
23 hPa, 2015 |
2 hPa, 2009 |
| Measure | Value [% of max] |
Month cumul. | Record High | Record Low |
| Sun Hours |
0 [0%] | 32 hrs (49%) [14%] |
8 [100%], 2020 |
0 [0%], 2011 |
| Wet Hours |
6
[Mean rain rate: 0.2 mm/h] | 65 hrs (104%) [9.4%] |
17, 2014 |
, 2009 |
| Cloud Cover |
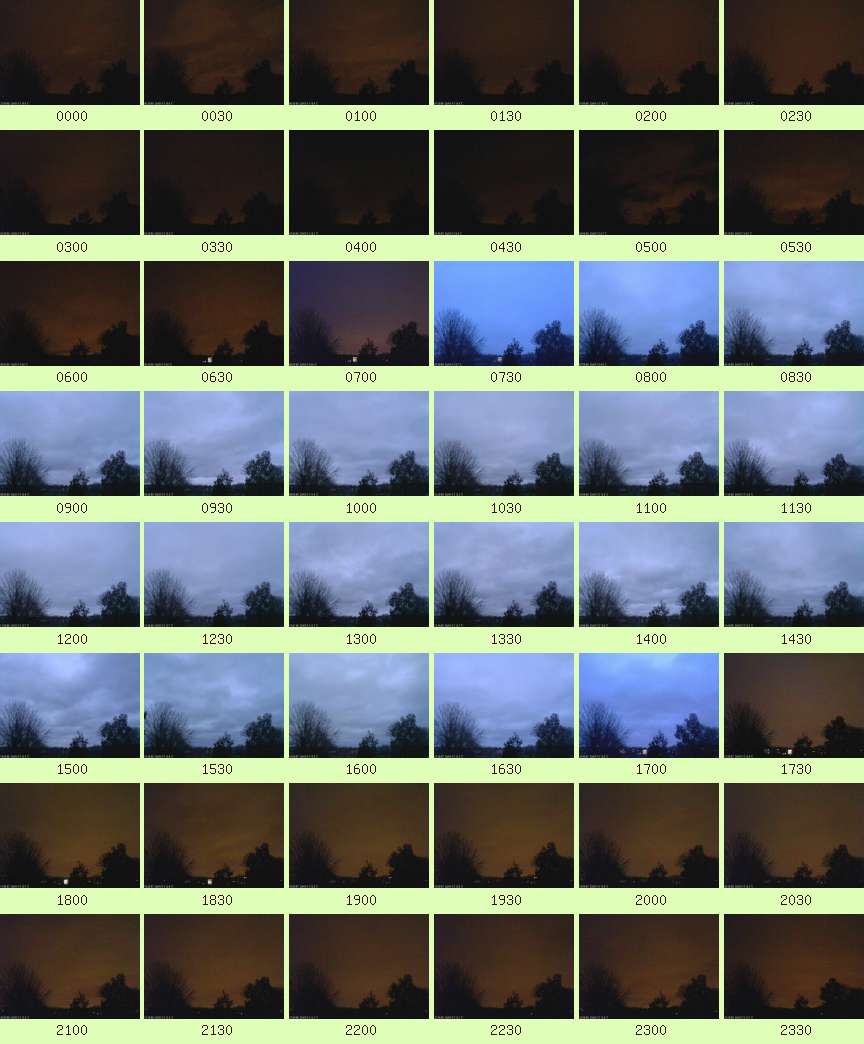
Overcast |
| Events |
None |
| Comments |
13 Moderate Shower; o.night, 16- broken Slight Rain/Drizzle |
| Extra Comments |
|
| Issues |
None known |
| Observer Absent? |
No |
| Pond Temperature @ Hampstead Heath |
0.0 °C |


 Large resolution version
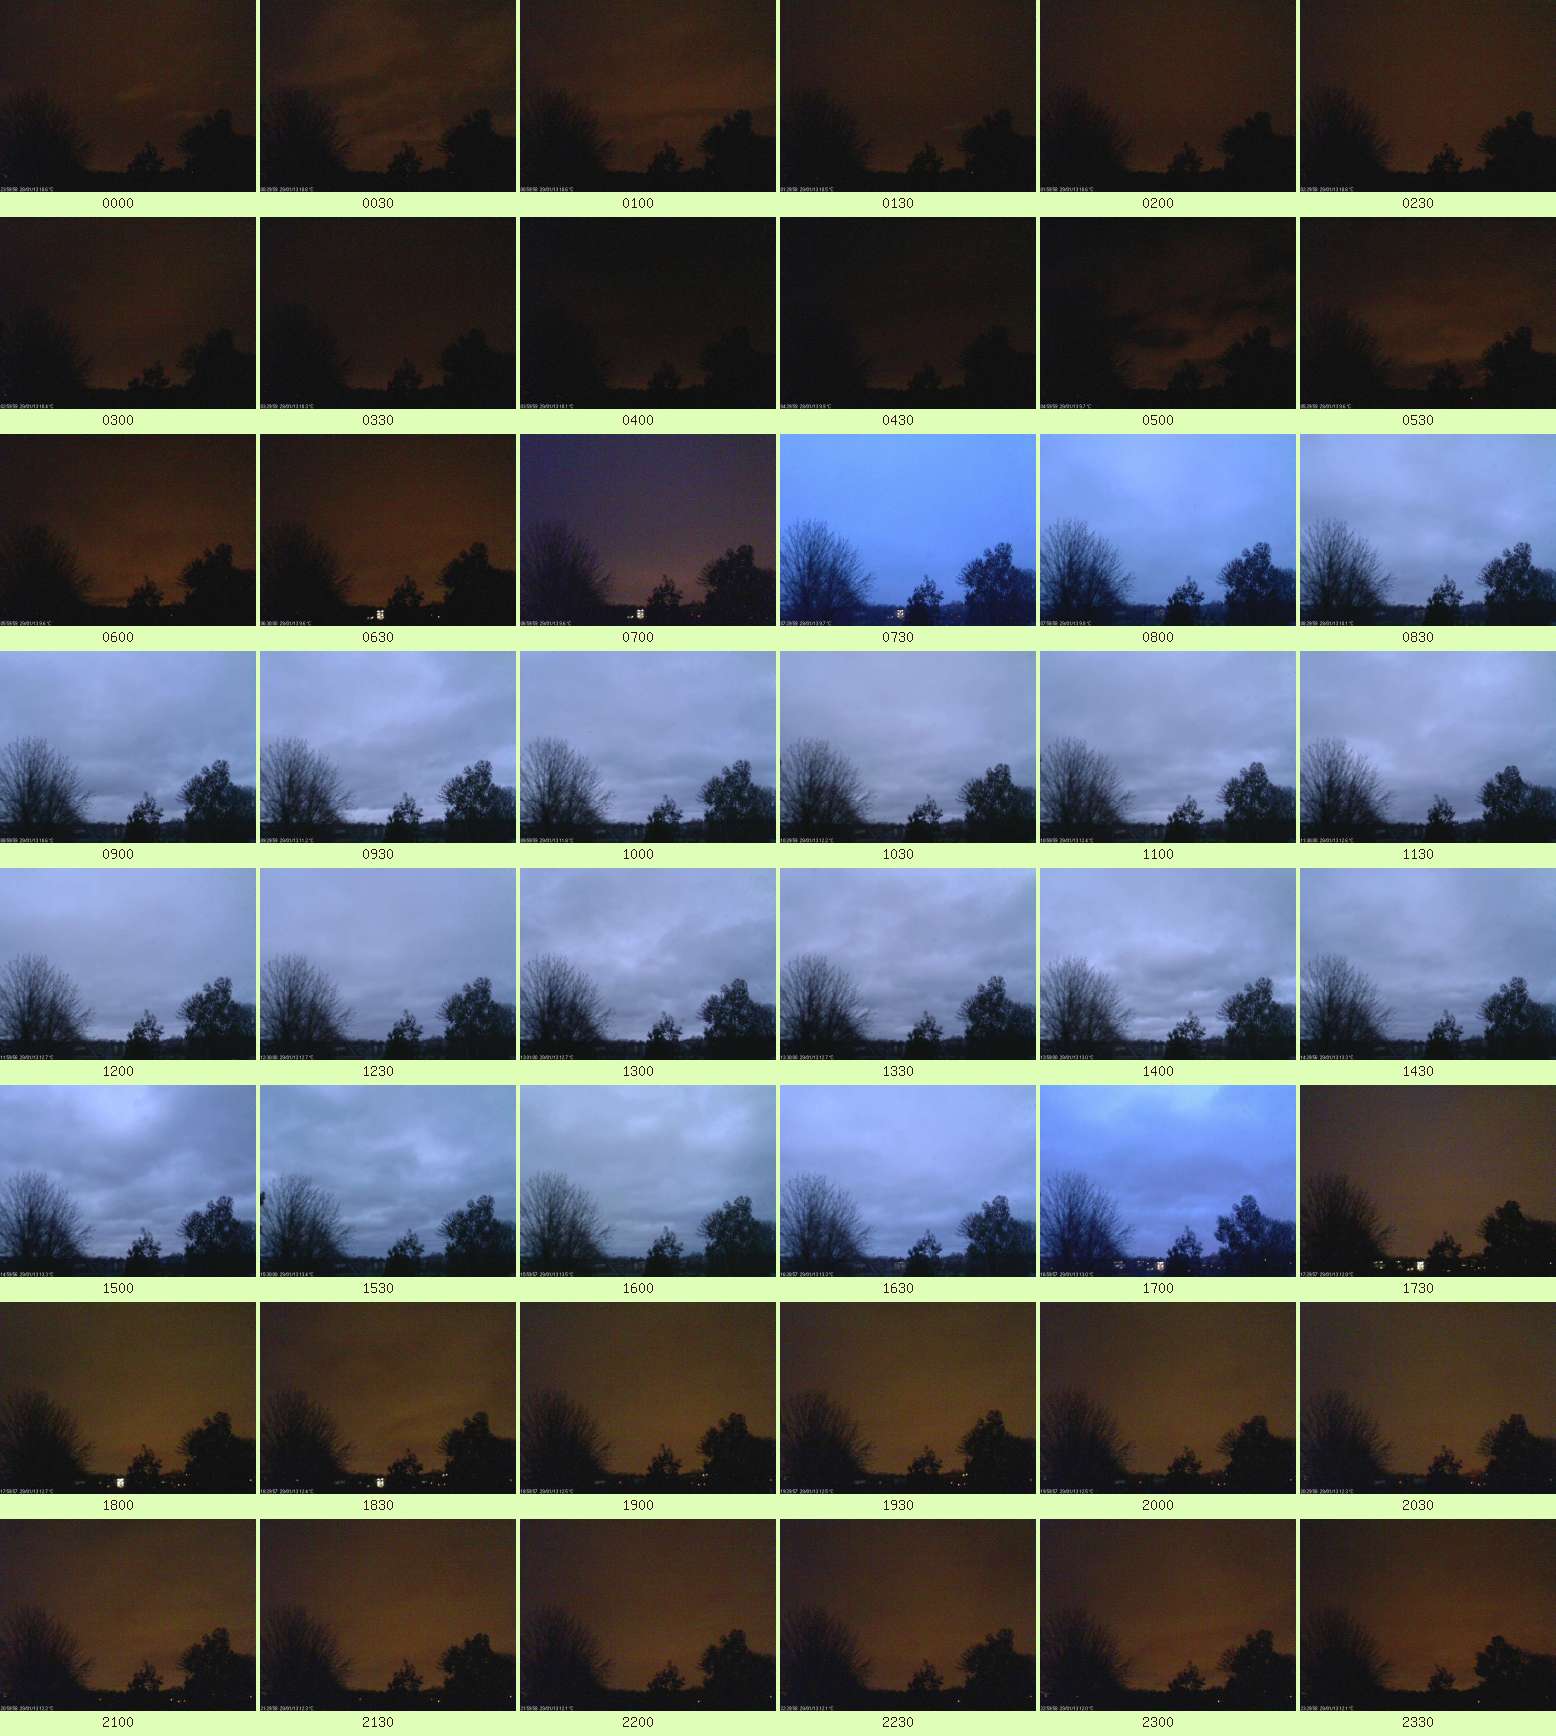