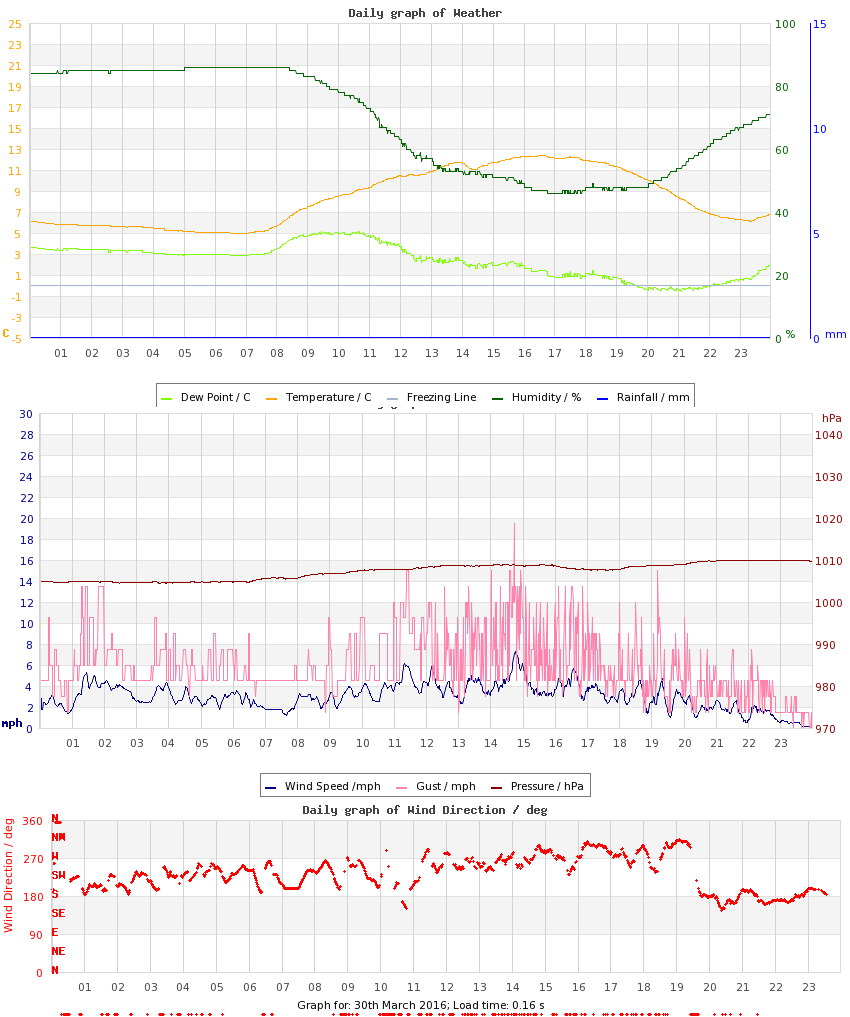
| Measure | Value (anomaly) | Time |
Month cumul. | Record High | Record Low |
| Minimum Temperature |
5.0 °C (-0.3) |
06:47 |
3.5 °C (-1.0) |
12.3 °C (+7.0), 2017 |
0.1 °C (-5.2), 2013 |
| Maximum Temperature |
12.4 °C (-0.3) |
16:35 |
10.1 °C (-1.0) |
23.6 °C (+10.9), 2021 |
4.8 °C (-7.9), 2013 |
| Mean Temperature |
8.3 °C (-0.3) |
|
6.7 °C (-1.0) |
16.4 °C, 2017 |
2.4 °C, 2013 |
| Minimum Humidity |
46% |
17:19 |
55% |
83%, 2018 |
28%, 2021 |
| Maximum Humidity |
86% |
06:42 |
88% |
96%, 2024 |
76%, 2013 |
| Mean Humidity |
68% |
|
74% |
90%, 2018 |
58%, 2014 |
| Minimum Pressure |
1004 hPa |
02:45 |
1009 hPa |
1032 hPa, 2020 |
984 hPa, 2010 |
| Maximum Pressure |
1010 hPa |
21:55 |
1018 hPa |
1040 hPa, 2020 |
992 hPa, 2010 |
| Mean Pressure |
1007 hPa |
|
1014 hPa |
1035 hPa, 2020 |
988 hPa, 2010 |
| Mean Wind Speed |
3.0 mph (-2.2) |
|
4.2 mph (-1.0) |
9.9 mph, 2023 |
1.4 mph, 2009 |
| Maximum Wind Speed |
9.1 mph |
16:17 |
11.5 mph |
20.4 mph, 2023 |
7.4 mph, 2012 |
| Maximum Gust |
19.5 mph |
14:43 |
20.7 mph |
31.1 mph, 2023 |
10.0 mph, 2009 |
| Mean Wind Direction |
WSW |
|
|
|
|
| Rainfall |
0.0 mm |
|
63.3 mm (168%) |
10.8 mm, 2018 |
|
| Maximum Hourly Rain |
n/a |
|
|
3.5, 2018 |
|
| Maximum 10-min Rain |
n/a |
|
|
0.9, 2018 |
|
| Maximum Rain Rate |
n/a |
|
|
6.6, 2018 |
|
| Minimum Dew Point |
-0.6 °C |
21:07 |
-1.2 °C |
8.3 °C, 2023 |
-5.1 °C, 2013 |
| Maximum Dew Point |
5.2 °C |
10:03 |
5.4 °C |
11.7 °C, 2023 |
-2.2 °C, 2013 |
| Mean Dew Point |
2.4 °C |
|
2.2 °C |
9.7 °C, 2023 |
-3.7 °C, 2013 |
| Measure | Value | Time |
Month cumul. | Record High | Record Low |
| Night Minimum (21-09) |
5.0 °C |
06:47 |
3.8 °C |
12.3 °C, 2017 |
0.7 °C, 2013 |
| Day Maximum (09-21) |
12.4 °C |
16:35 |
10.0 °C |
23.6 °C, 2021 |
4.8 °C, 2013 |
| Max 10m Temp Rise |
0.5 °C |
08:26 |
0.5 °C |
1.2 °C, 2021 |
0.3 °C, 2011 |
| Max 1hr Temp Rise |
2.0 °C |
08:44 |
1.7 °C |
5.3 °C, 2021 |
0.9 °C, 2011 |
| Max 1hr Hum Rise |
8% |
21:56 |
8% |
17%, 2015 |
4%, 2009 |
| Max 10m Temp Fall |
0.4 °C |
14:14 |
0.5 °C |
1.3 °C, 2020 |
0.3 °C, 2015 |
| Max 1hr Temp Fall |
1.9 °C |
21:33 |
1.7 °C |
3.8 °C, 2021 |
0.7 °C, 2018 |
| Max 1hr Hum Fall |
11% |
11:35 |
11% |
24%, 2014 |
7%, 2022 |
| Max 10m Wind Speed |
7.3 mph |
14:45 |
8.1 mph |
15.2 mph, 2023 |
5.4 mph, 2012 |
| Minimum Feels-like |
1.8 °C |
01:49 |
-0.1 °C |
12.4 °C, 2017 |
-4.4 °C, 2013 |
| Maximum Feels-like |
12.4 °C |
16:28 |
9.7 °C |
23.6 °C, 2021 |
2.8 °C, 2013 |
| Mean Feels-like |
7.3 °C |
|
4.9 °C |
16.9 °C, 2017 |
-1.0 °C, 2013 |
| Air-frost Hrs |
0 hrs |
|
0.2 hrs |
0 hrs, 2009 |
0 hrs, 2009 |
| Measure | Value (anomaly) |
Month cumul. | Record High | Record Low |
| Temperature Range |
7.4 °C (+0.0) |
6.6 °C (-0.1) |
19.8 °C (+12.4), 2021 |
2.0 °C (-5.4), 2011 |
| Humidity Range |
40% |
34% |
65%, 2021 |
12%, 2018 |
| Pressure Range |
6 hPa |
8 hPa |
12 hPa, 2015 |
2 hPa, 2011 |
| Measure | Value [% of max] |
Month cumul. | Record High | Record Low |
| Sun Hours |
8 [69%] | 110 hrs (100%) [34%] |
11.5 [100%], 2021 |
0 [0%], 2011 |
| Wet Hours |
0 | 62 hrs (121%) [8.7%] |
7, 2018 |
, 2009 |
| Cloud Cover |
am: Mostly Sunny or Hazy
pm: Hazy |
| Events |
None |
| Comments |
- |
| Extra Comments |
|
| Issues |
Wind data from Tottenham (TODO: calibration) |
| Observer Absent? |
Yes - observations may be unreliable |
| Pond Temperature @ Hampstead Heath |
0.0 °C |


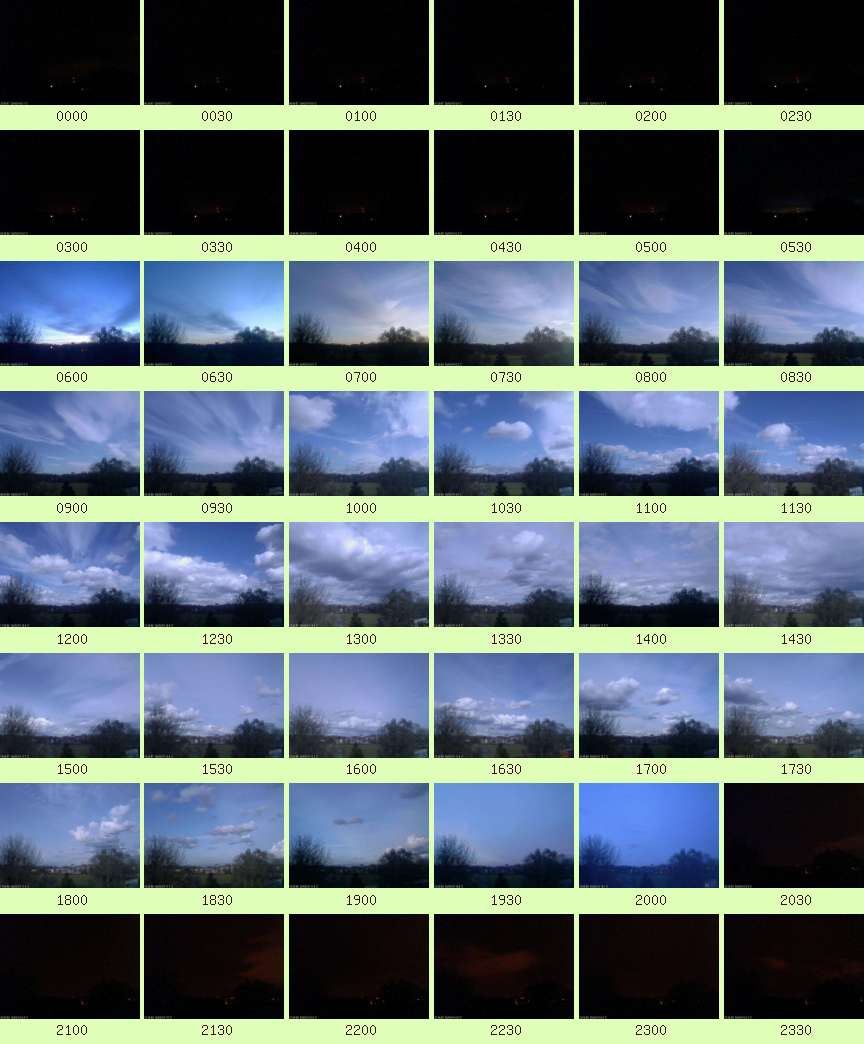 Large resolution version