| Measure | Value (anomaly) | Time |
Month cumul. | Record High | Record Low |
| Minimum Temperature |
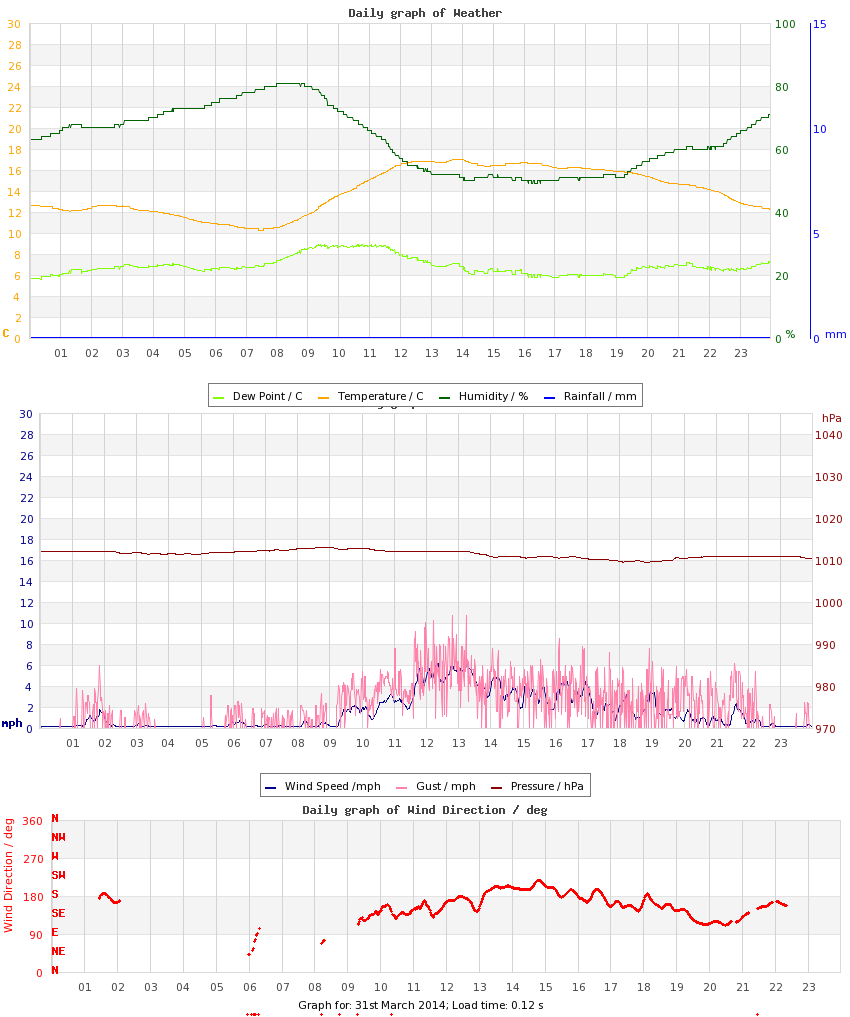
10.3 °C (+5.0) |
07:29 |
4.9 °C (+0.5) |
11.2 °C (+5.9), 2017 |
-2.6 °C (-7.9), 2013 |
| Maximum Temperature |
17.0 °C (+4.3) |
13:52 |
13.5 °C (+2.4) |
21.1 °C (+8.4), 2021 |
5.6 °C (-7.1), 2013 |
| Mean Temperature |
13.9 °C (+4.7) |
|
9.0 °C (+1.5) |
14.4 °C, 2021 |
1.8 °C, 2013 |
| Minimum Humidity |
49% |
16:20 |
48% |
83%, 2023 |
37%, 2015 |
| Maximum Humidity |
81% |
08:26 |
89% |
97%, 2011 |
73%, 2009 |
| Mean Humidity |
63% |
|
71% |
92%, 2023 |
56%, 2015 |
| Minimum Pressure |
1010 hPa |
18:21 |
1012 hPa |
1030 hPa, 2020 |
981 hPa, 2010 |
| Maximum Pressure |
1014 hPa |
10:03 |
1019 hPa |
1034 hPa, 2020 |
998 hPa, 2023 |
| Mean Pressure |
1012 hPa |
|
1015 hPa |
1032 hPa, 2020 |
990 hPa, 2023 |
| Mean Wind Speed |
1.5 mph (-3.7) |
|
4.7 mph (-0.5) |
12.7 mph, 2015 |
1.0 mph, 2021 |
| Maximum Wind Speed |
9.4 mph |
11:44 |
13.3 mph |
30.1 mph, 2015 |
7.3 mph, 2021 |
| Maximum Gust |
13.7 mph |
12:48 |
18.7 mph |
39.8 mph, 2015 |
10.3 mph, 2021 |
| Mean Wind Direction |
SSE |
|
|
|
|
| Rainfall |
0.0 mm |
|
22.9 mm (59%) |
12.5 mm, 2023 |
|
| Maximum Hourly Rain |
n/a |
|
|
3.6, 2023 |
|
| Maximum 10-min Rain |
n/a |
|
|
1.2, 2023 |
|
| Maximum Rain Rate |
n/a |
|
|
14.4, 2023 |
|
| Minimum Dew Point |
5.6 °C |
00:21 |
0.9 °C |
8.7 °C, 2023 |
-7.5 °C, 2013 |
| Maximum Dew Point |
8.9 °C |
10:16 |
6.7 °C |
12.6 °C, 2011 |
-1.6 °C, 2013 |
| Mean Dew Point |
6.9 °C |
|
3.6 °C |
9.6 °C, 2011 |
-5.2 °C, 2013 |
| Measure | Value | Time |
Month cumul. | Record High | Record Low |
| Night Minimum (21-09) |
10.3 °C |
07:29 |
5.1 °C |
13.0 °C, 2017 |
-2.6 °C, 2013 |
| Day Maximum (09-21) |
17.0 °C |
13:52 |
13.5 °C |
21.1 °C, 2021 |
5.6 °C, 2013 |
| Max 10m Temp Rise |
0.5 °C |
09:21 |
0.6 °C |
1.5 °C, 2025 |
0.3 °C, 2012 |
| Max 1hr Temp Rise |
1.9 °C |
09:46 |
2.5 °C |
4.8 °C, 2025 |
0.8 °C, 2012 |
| Max 1hr Hum Rise |
7% |
23:23 |
9% |
25%, 2022 |
5%, 2017 |
| Max 10m Temp Fall |
0.4 °C |
22:44 |
0.5 °C |
1.0 °C, 2015 |
0.2 °C, 2017 |
| Max 1hr Temp Fall |
1.4 °C |
23:07 |
1.6 °C |
2.4 °C, 2026 |
0.9 °C, 2024 |
| Max 1hr Hum Fall |
9% |
10:17 |
14% |
25%, 2015 |
4%, 2024 |
| Max 10m Wind Speed |
6.2 mph |
12:20 |
10.0 mph |
21.3 mph, 2015 |
5.0 mph, 2021 |
| Minimum Feels-like |
10.3 °C |
07:25 |
2.5 °C |
11.2 °C, 2017 |
-6.1 °C, 2013 |
| Maximum Feels-like |
17.1 °C |
12:22 |
13.5 °C |
22.9 °C, 2021 |
4.0 °C, 2013 |
| Mean Feels-like |
14.1 °C |
|
8.0 °C |
15.2 °C, 2021 |
-0.9 °C, 2022 |
| Air-frost Hrs |
0 hrs |
|
0.1 hrs |
7 hrs, 2013 |
0 hrs, 2009 |
| Minimum PM2.5 |
0 |
|
0 |
0, 2009 |
0, 2012 |
| Maximum PM2.5 |
n/a |
|
0 |
n/a |
n/a |
| Mean PM2.5 |
n/a |
|
0 |
n/a |
n/a |
| Measure | Value (anomaly) |
Month cumul. | Record High | Record Low |
| Temperature Range |
6.7 °C (-0.7) |
8.6 °C (+1.9) |
13.8 °C (+6.4), 2021 |
3.4 °C (-4.0), 2010 |
| Humidity Range |
32% |
40% |
53%, 2015 |
11%, 2023 |
| Pressure Range |
4 hPa |
7 hPa |
22 hPa, 2015 |
2 hPa, 2013 |
| Measure | Value [% of max] |
Month cumul. | Record High | Record Low |
| Sun Hours |
0.5 [4%] | 158 hrs (139%) [48%] |
11.5 [100%], 2025 |
0 [0%], 2023 |
| Wet Hours |
0 | 25 hrs (47%) [3.3%] |
14, 2023 |
, 2009 |
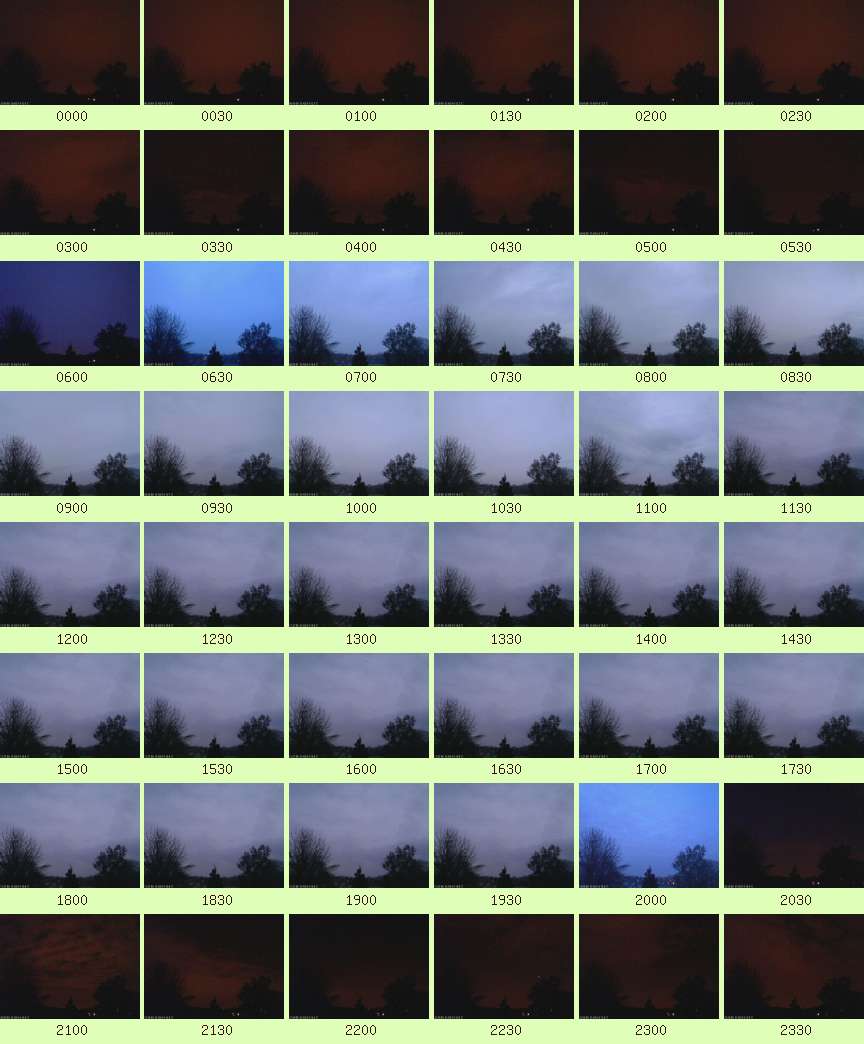
| Cloud Cover |
Overcast or Mostly Cloudy |
| Events |
None |
| Comments |
- |
| Extra Comments |
|
| Issues |
Power cut at 11:30, Weather server relaunced at 20:00 - data recovered from logger |
| Observer Absent? |
No |
| Pond Temperature @ Hampstead Heath |
0.0 °C |


 Large resolution version
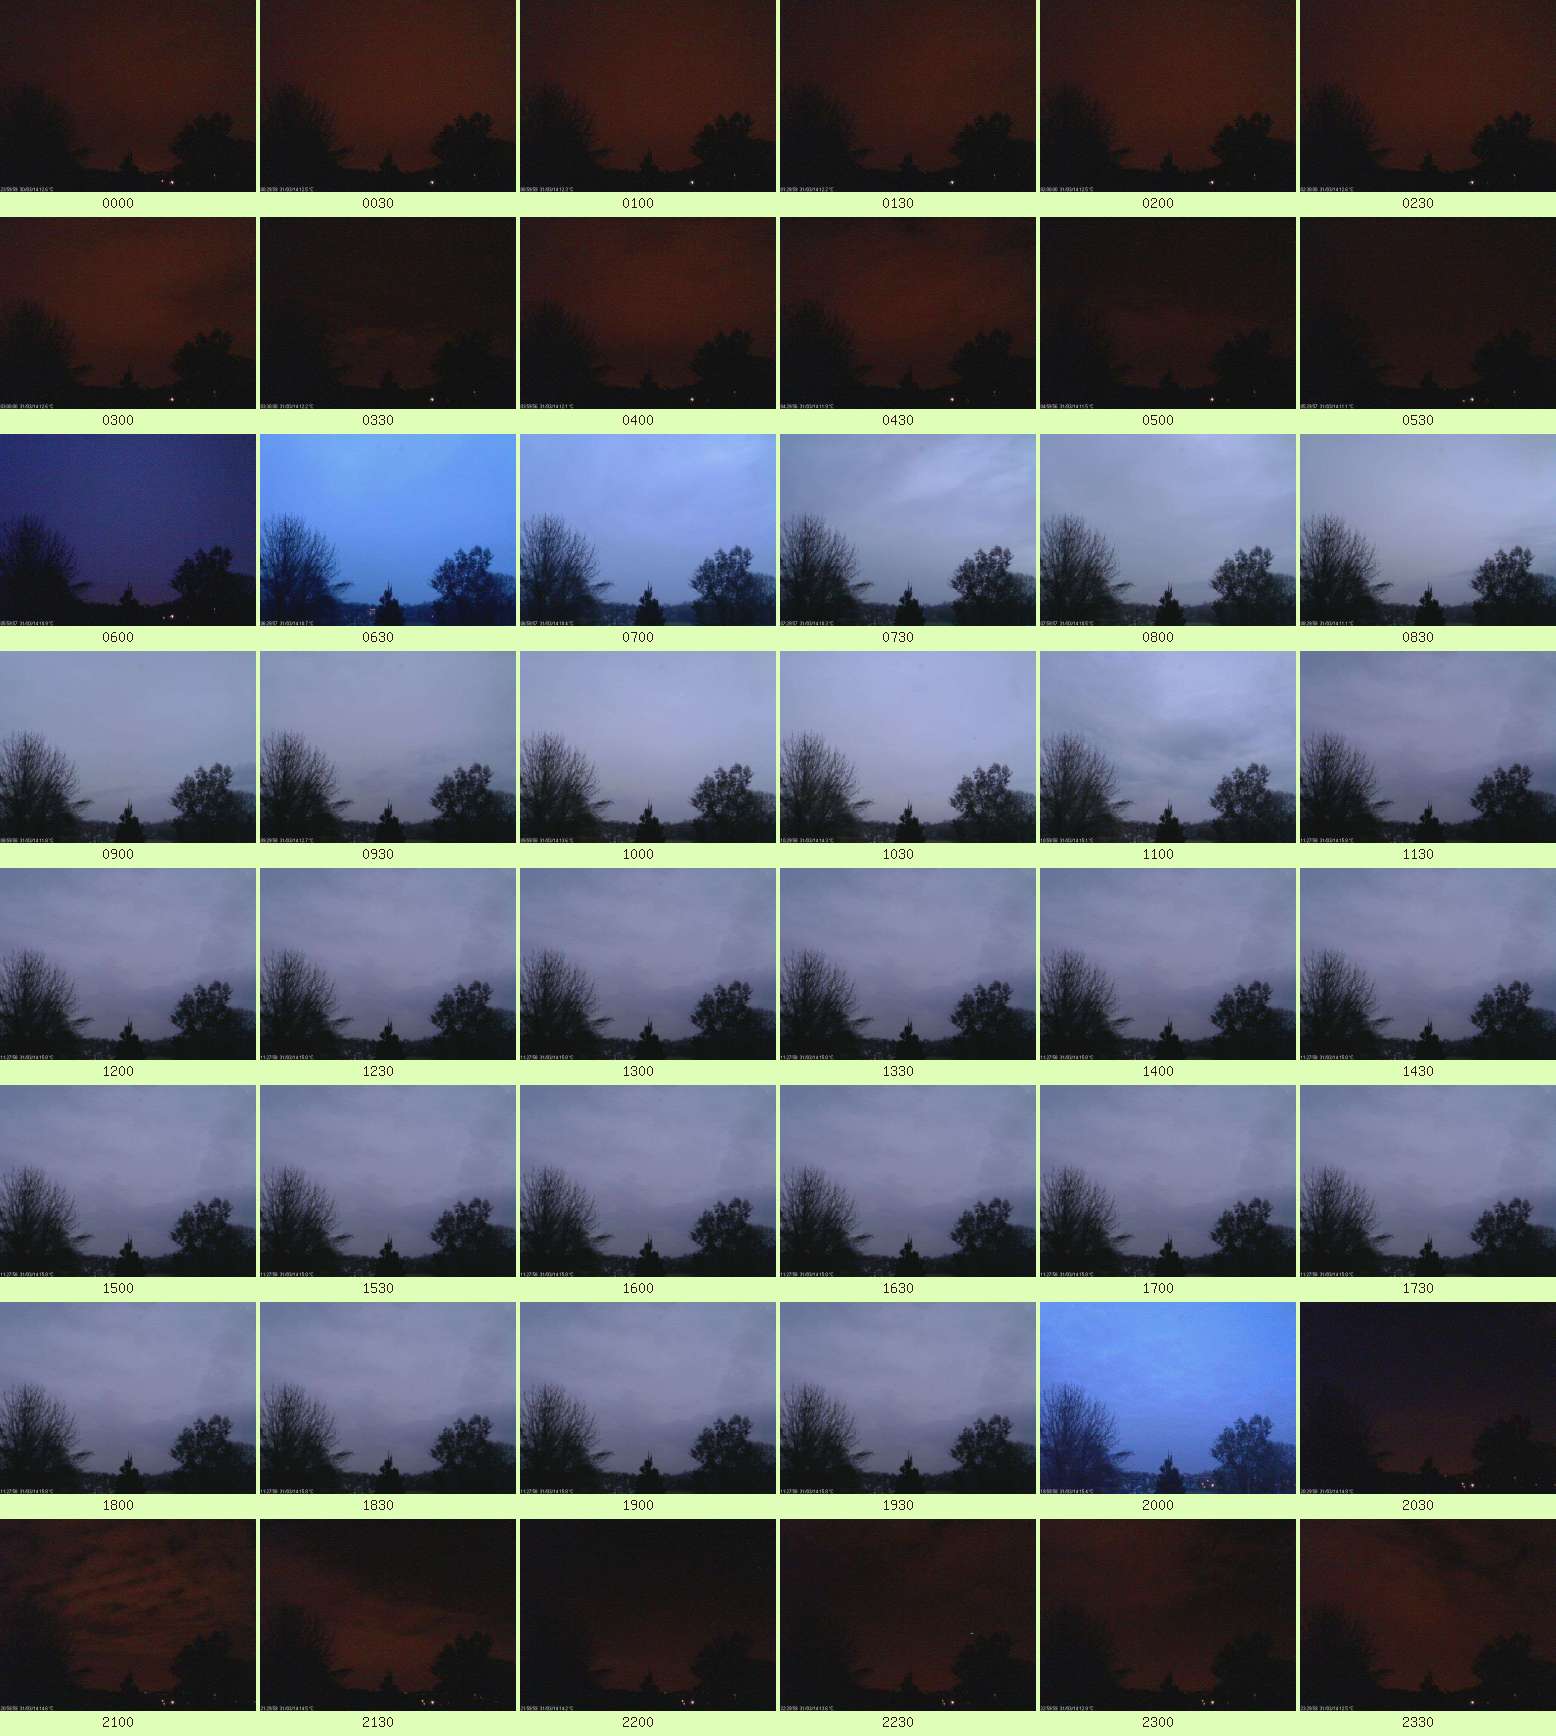