| Measure | Value (anomaly) | Time |
Month cumul. | Record High | Record Low |
| Minimum Temperature |
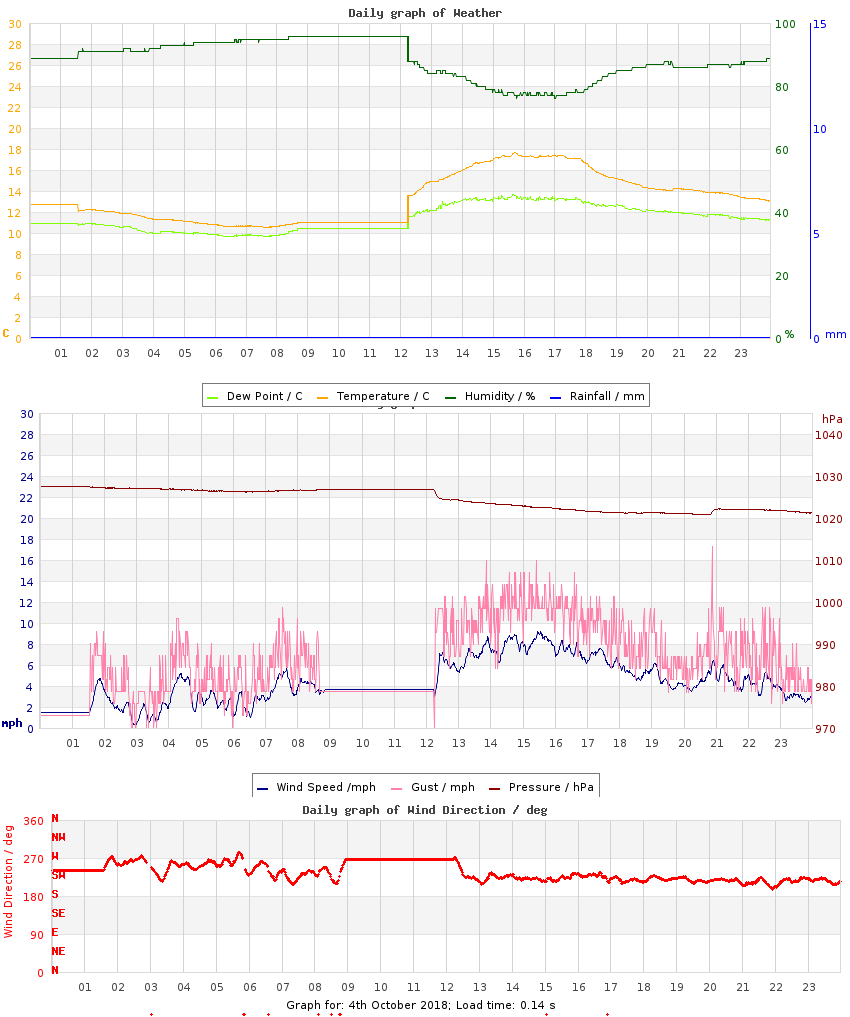
10.5 °C (+0.7) |
07:39 |
10.2 °C (+0.3) |
15.8 °C (+6.0), 2011 |
5.1 °C (-4.7), 2024 |
| Maximum Temperature |
17.7 °C (+1.3) |
15:42 |
17.9 °C (+1.4) |
20.4 °C (+4.0), 2013 |
10.9 °C (-5.5), 2020 |
| Mean Temperature |
13.6 °C (+1.0) |
|
13.8 °C (+0.9) |
17.7 °C, 2013 |
9.8 °C, 2020 |
| Minimum Humidity |
76% |
17:01 |
62% |
92%, 2020 |
49%, 2025 |
| Maximum Humidity |
96% |
10:18 |
88% |
98%, 2010 |
81%, 2011 |
| Mean Humidity |
88% |
|
77% |
95%, 2010 |
69%, 2009 |
| Minimum Pressure |
1021 hPa |
20:34 |
1021 hPa |
1030 hPa, 2016 |
981 hPa, 2020 |
| Maximum Pressure |
1028 hPa |
00:46 |
1026 hPa |
1032 hPa, 2016 |
989 hPa, 2020 |
| Mean Pressure |
1025 hPa |
|
1024 hPa |
1031 hPa, 2016 |
984 hPa, 2020 |
| Mean Wind Speed |
4.4 mph (+0.3) |
|
4.9 mph (+0.8) |
10.5 mph, 2025 |
1.4 mph, 2024 |
| Maximum Wind Speed |
11.5 mph |
20:50 |
12.9 mph |
22.6 mph, 2025 |
7.1 mph, 2010 |
| Maximum Gust |
17.3 mph |
20:52 |
20.0 mph |
38.0 mph, 2025 |
10.5 mph, 2010 |
| Mean Wind Direction |
SW |
|
|
|
|
| Rainfall |
0.0 mm |
|
0.0 mm (0%) |
23.0 mm, 2020 |
|
| Maximum Hourly Rain |
n/a |
|
|
4, 2021 |
|
| Maximum 10-min Rain |
n/a |
|
|
2.2, 2021 |
|
| Maximum Rain Rate |
n/a |
|
|
30, 2021 |
|
| Minimum Dew Point |
9.7 °C |
06:26 |
7.1 °C |
12.8 °C, 2013 |
3.5 °C, 2025 |
| Maximum Dew Point |
13.7 °C |
15:38 |
11.6 °C |
17.4 °C, 2013 |
9.0 °C, 2012 |
| Mean Dew Point |
11.4 °C |
|
9.6 °C |
15.2 °C, 2013 |
7.0 °C, 2009 |
| Measure | Value | Time |
Month cumul. | Record High | Record Low |
| Night Minimum (21-09) |
10.5 °C |
07:41 |
10.4 °C |
16.3 °C, 2013 |
5.1 °C, 2024 |
| Day Maximum (09-21) |
17.7 °C |
15:42 |
17.9 °C |
20.4 °C, 2013 |
10.6 °C, 2020 |
| Max 10m Temp Rise |
0.6 °C |
12:25 |
0.7 °C |
0.6 °C, 2012 |
0.2 °C, 2020 |
| Max 1hr Temp Rise |
1.8 °C |
13:15 |
1.8 °C |
3.1 °C, 2015 |
0.7 °C, 2020 |
| Max 1hr Hum Rise |
6% |
18:44 |
6% |
16%, 2021 |
2%, 2020 |
| Max 10m Temp Fall |
0.6 °C |
01:34 |
0.6 °C |
1.3 °C, 2025 |
0.2 °C, 2022 |
| Max 1hr Temp Fall |
1.8 °C |
18:44 |
1.7 °C |
2.9 °C, 2024 |
0.7 °C, 2022 |
| Max 1hr Hum Fall |
7% |
12:53 |
8% |
18%, 2024 |
1%, 2020 |
| Max 10m Wind Speed |
9.2 mph |
15:33 |
10.1 mph |
18.1 mph, 2025 |
5.2 mph, 2010 |
| Minimum Feels-like |
11.6 °C |
07:33 |
10.2 °C |
18.6 °C, 2013 |
0.0 °C, 2009 |
| Maximum Feels-like |
20.8 °C |
15:41 |
20.0 °C |
24.5 °C, 2013 |
0.0 °C, 2009 |
| Mean Feels-like |
15.3 °C |
|
15.0 °C |
21.8 °C, 2013 |
0.0 °C, 2009 |
| Air-frost Hrs |
0 hrs |
|
0 hrs |
0 hrs, 2009 |
0 hrs, 2009 |
| Minimum PM2.5 |
0 |
|
0 |
0, 2009 |
0, 2021 |
| Maximum PM2.5 |
n/a |
|
0 |
n/a |
n/a |
| Mean PM2.5 |
n/a |
|
0 |
n/a |
n/a |
| Measure | Value (anomaly) |
Month cumul. | Record High | Record Low |
| Temperature Range |
7.2 °C (+0.6) |
7.7 °C (+1.1) |
11.2 °C (+4.6), 2024 |
2.0 °C (-4.6), 2020 |
| Humidity Range |
20% |
26% |
44%, 2025 |
3%, 2020 |
| Pressure Range |
7 hPa |
6 hPa |
13 hPa, 2025 |
2 hPa, 2010 |
| Measure | Value [% of max] |
Month cumul. | Record High | Record Low |
| Sun Hours |
1 [10%] | 16 hrs (97%) [39%] |
9 [87%], 2016 |
0 [0%], 2020 |
| Wet Hours |
0 | 0 hrs (0%) [0%] |
18, 2020 |
0, 2009 |
| Cloud Cover |
am: Overcast
pm: Mostly Cloudy transitioned to Mostly Sunny |
| Events |
None |
| Comments |
- |
| Extra Comments |
|
| Issues |
New PC day 1. 09-12 data loss |
| Observer Absent? |
Yes - observations may be unreliable |
| Pond Temperature @ Hampstead Heath |
0.0 °C |


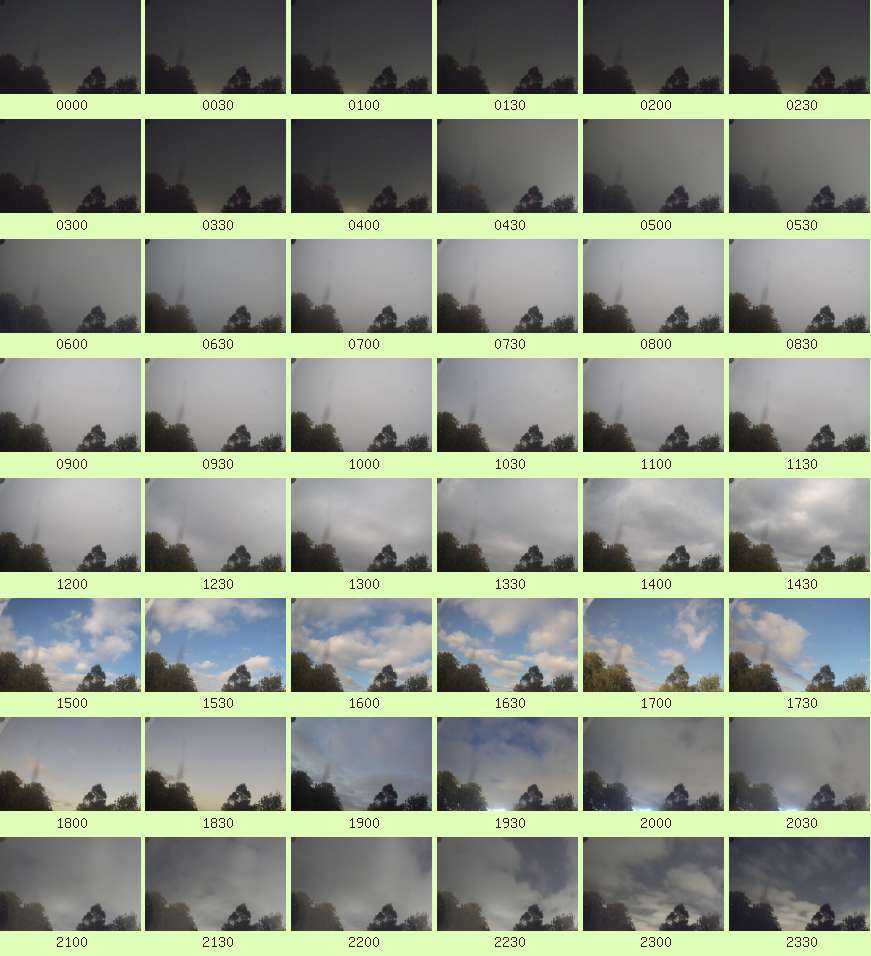 Full resolution individual images at up-to 5 minute intervals