| Measure | Value (anomaly) | Time |
Month cumul. | Record High | Record Low |
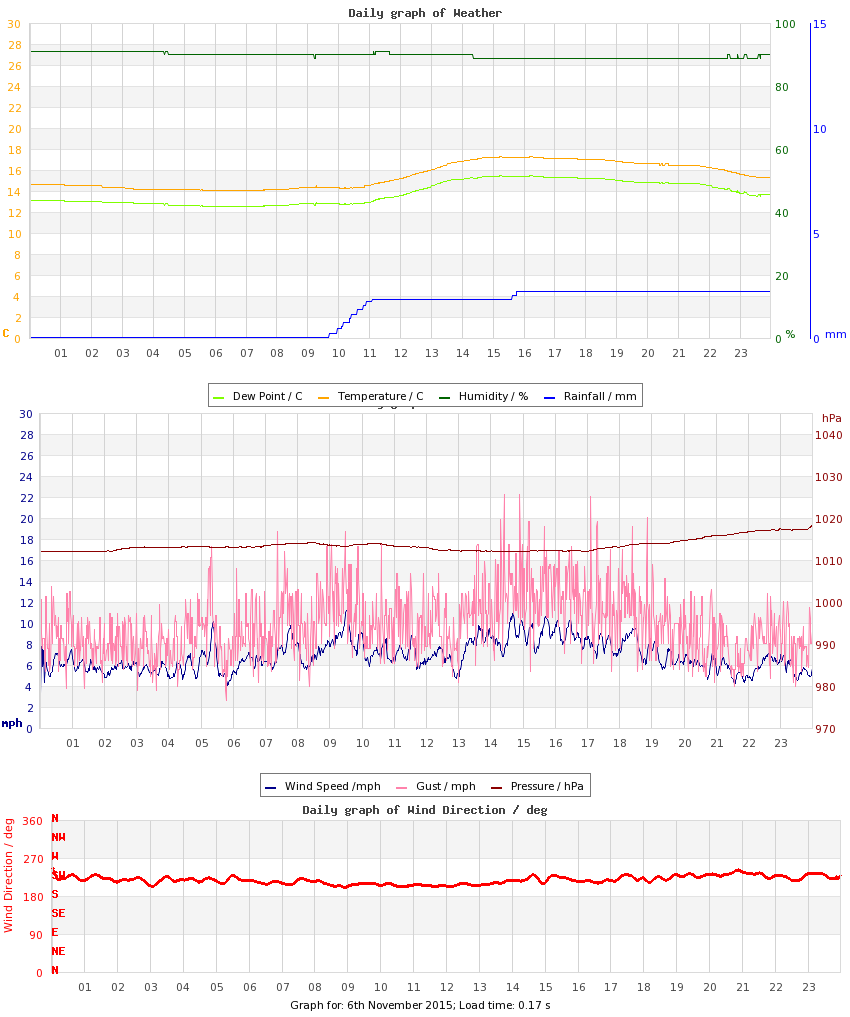
| Minimum Temperature |
14.1 °C (+7.6) |
06:33 |
10.4 °C (+3.8) |
14.1 °C (+7.6), 2015 |
0.3 °C (-6.2), 2014 |
| Maximum Temperature |
17.3 °C (+5.6) |
15:45 |
14.4 °C (+2.4) |
17.3 °C (+5.6), 2015 |
6.7 °C (-5.0), 2016 |
| Mean Temperature |
15.5 °C (+6.6) |
|
12.5 °C (+3.1) |
15.7 °C, 2025 |
4.2 °C, 2016 |
| Minimum Humidity |
89% |
16:25 |
90% |
93%, 2024 |
61%, 2016 |
| Maximum Humidity |
91% |
05:49 |
94% |
98%, 2013 |
81%, 2016 |
| Mean Humidity |
90% |
|
93% |
95%, 2024 |
71%, 2016 |
| Minimum Pressure |
1012 hPa |
08:30 |
1016 hPa |
1027 hPa, 2024 |
993 hPa, 2009 |
| Maximum Pressure |
1018 hPa |
23:58 |
1021 hPa |
1036 hPa, 2020 |
1001 hPa, 2013 |
| Mean Pressure |
1014 hPa |
|
1018 hPa |
1032 hPa, 2024 |
998 hPa, 2009 |
| Mean Wind Speed |
6.9 mph (+2.3) |
|
3.2 mph (-1.3) |
10.1 mph, 2016 |
1.1 mph, 2020 |
| Maximum Wind Speed |
14.5 mph |
09:29 |
9.1 mph |
18.5 mph, 2016 |
5.0 mph, 2020 |
| Maximum Gust |
22.3 mph |
14:25 |
12.7 mph |
33.9 mph, 2016 |
8.0 mph, 2020 |
| Mean Wind Direction |
SW |
|
|
|
|
| Rainfall |
2.0 mm |
|
13.5 mm (101%) |
27.4 mm, 2022 |
|
| Maximum Hourly Rain |
1.5 mm |
10:53 |
|
14.9 mm, 2022 |
|
| Maximum 10-min Rain |
0.4 mm |
10:24 |
|
4.1 mm, 2022 |
|
| Maximum Rain Rate |
3.6 mm/h |
10:24 |
|
48 mm/h, 2022 |
|
| Minimum Dew Point |
12.5 °C |
06:33 |
9.4 °C |
12.5 °C, 2015 |
-3.2 °C, 2016 |
| Maximum Dew Point |
15.5 °C |
15:45 |
13.1 °C |
15.5 °C, 2015 |
2.3 °C, 2016 |
| Mean Dew Point |
13.8 °C |
|
11.3 °C |
13.8 °C, 2015 |
-0.7 °C, 2016 |
| Measure | Value | Time |
Month cumul. | Record High | Record Low |
| Night Minimum (21-09) |
14.1 °C |
06:33 |
10.4 °C |
14.6 °C, 2025 |
0.3 °C, 2014 |
| Day Maximum (09-21) |
17.3 °C |
15:45 |
14.4 °C |
17.3 °C, 2015 |
6.7 °C, 2016 |
| Max 10m Temp Rise |
0.2 °C |
13:31 |
0.3 °C |
0.8 °C, 2014 |
0.2 °C, 2010 |
| Max 1hr Temp Rise |
1.0 °C |
13:11 |
1.0 °C |
3.6 °C, 2014 |
0.4 °C, 2022 |
| Max 1hr Hum Rise |
1% |
10:12 |
2% |
12%, 2009 |
1%, 2015 |
| Max 10m Temp Fall |
0.2 °C |
22:36 |
0.3 °C |
1.0 °C, 2009 |
0.1 °C, 2013 |
| Max 1hr Temp Fall |
0.7 °C |
22:59 |
1.1 °C |
2.2 °C, 2016 |
0.2 °C, 2013 |
| Max 1hr Hum Fall |
1% |
04:21 |
1% |
15%, 2014 |
1%, 2015 |
| Max 10m Wind Speed |
11.2 mph |
09:31 |
7.0 mph |
15.6 mph, 2016 |
0.0 mph, 2020 |
| Minimum Feels-like |
16.6 °C |
05:31 |
11.4 °C |
16.6 °C, 2015 |
-4.2 °C, 2016 |
| Maximum Feels-like |
21.6 °C |
15:13 |
17.3 °C |
21.6 °C, 2015 |
4.2 °C, 2016 |
| Mean Feels-like |
18.7 °C |
|
14.4 °C |
18.7 °C, 2015 |
-0.5 °C, 2016 |
| Air-frost Hrs |
0 hrs |
|
0 hrs |
0 hrs, 2009 |
0 hrs, 2009 |
| Measure | Value (anomaly) |
Month cumul. | Record High | Record Low |
| Temperature Range |
3.2 °C (-2.0) |
4.0 °C (-1.4) |
11.4 °C (+6.2), 2014 |
1.2 °C (-4.0), 2024 |
| Humidity Range |
2% |
4% |
32%, 2014 |
2%, 2015 |
| Pressure Range |
6 hPa |
6 hPa |
14 hPa, 2020 |
2 hPa, 2016 |
| Measure | Value [% of max] |
Month cumul. | Record High | Record Low |
| Sun Hours |
0 [0%] | 7.6 hrs (42%) [15%] |
8.3 [99%], 2017 |
0 [0%], 2009 |
| Wet Hours |
2
[Mean rain rate: 1.0 mm/h] | 16 hrs (127%) [11%] |
10, 2022 |
0, 2011 |
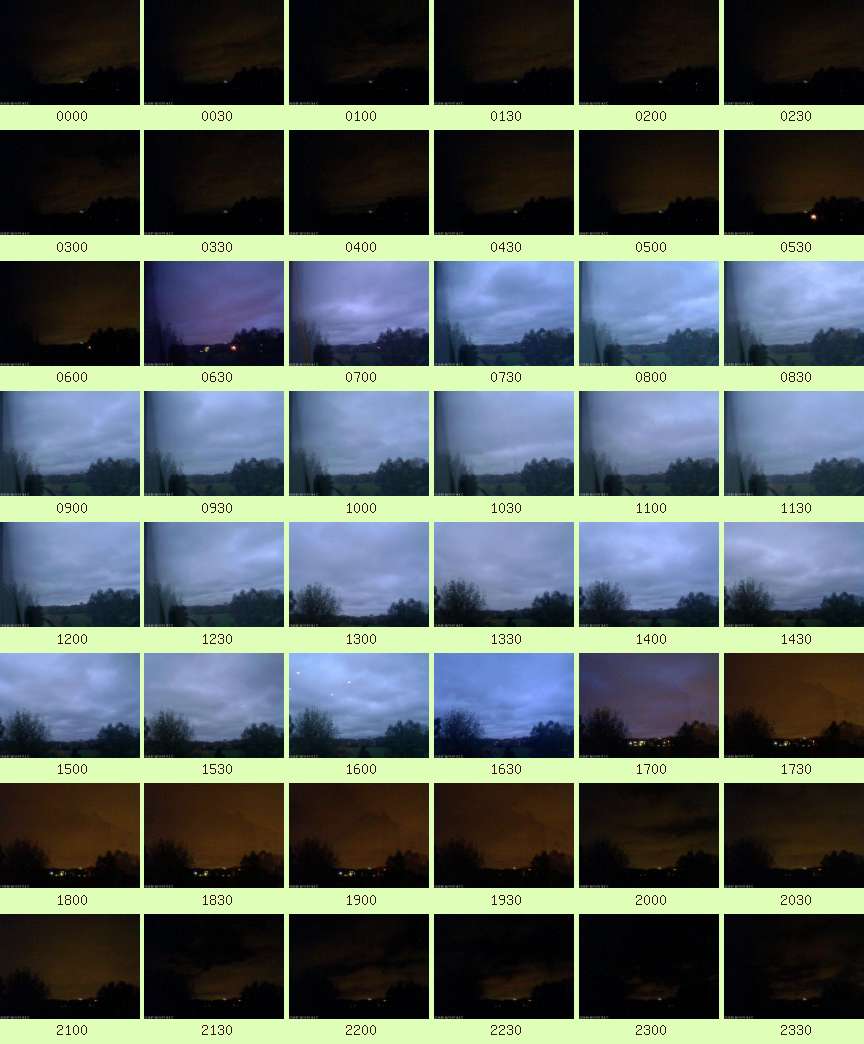
| Cloud Cover |
Overcast |
| Events |
None |
| Comments |
am Rain |
| Extra Comments |
Rain gauge batteries replaced; webcams moved to clearer window; radiation shield cleaned |
| Issues |
16 tips removed: false due to maintenance work |
| Observer Absent? |
No |
| Pond Temperature @ Hampstead Heath |
0.0 °C |


 Large resolution version
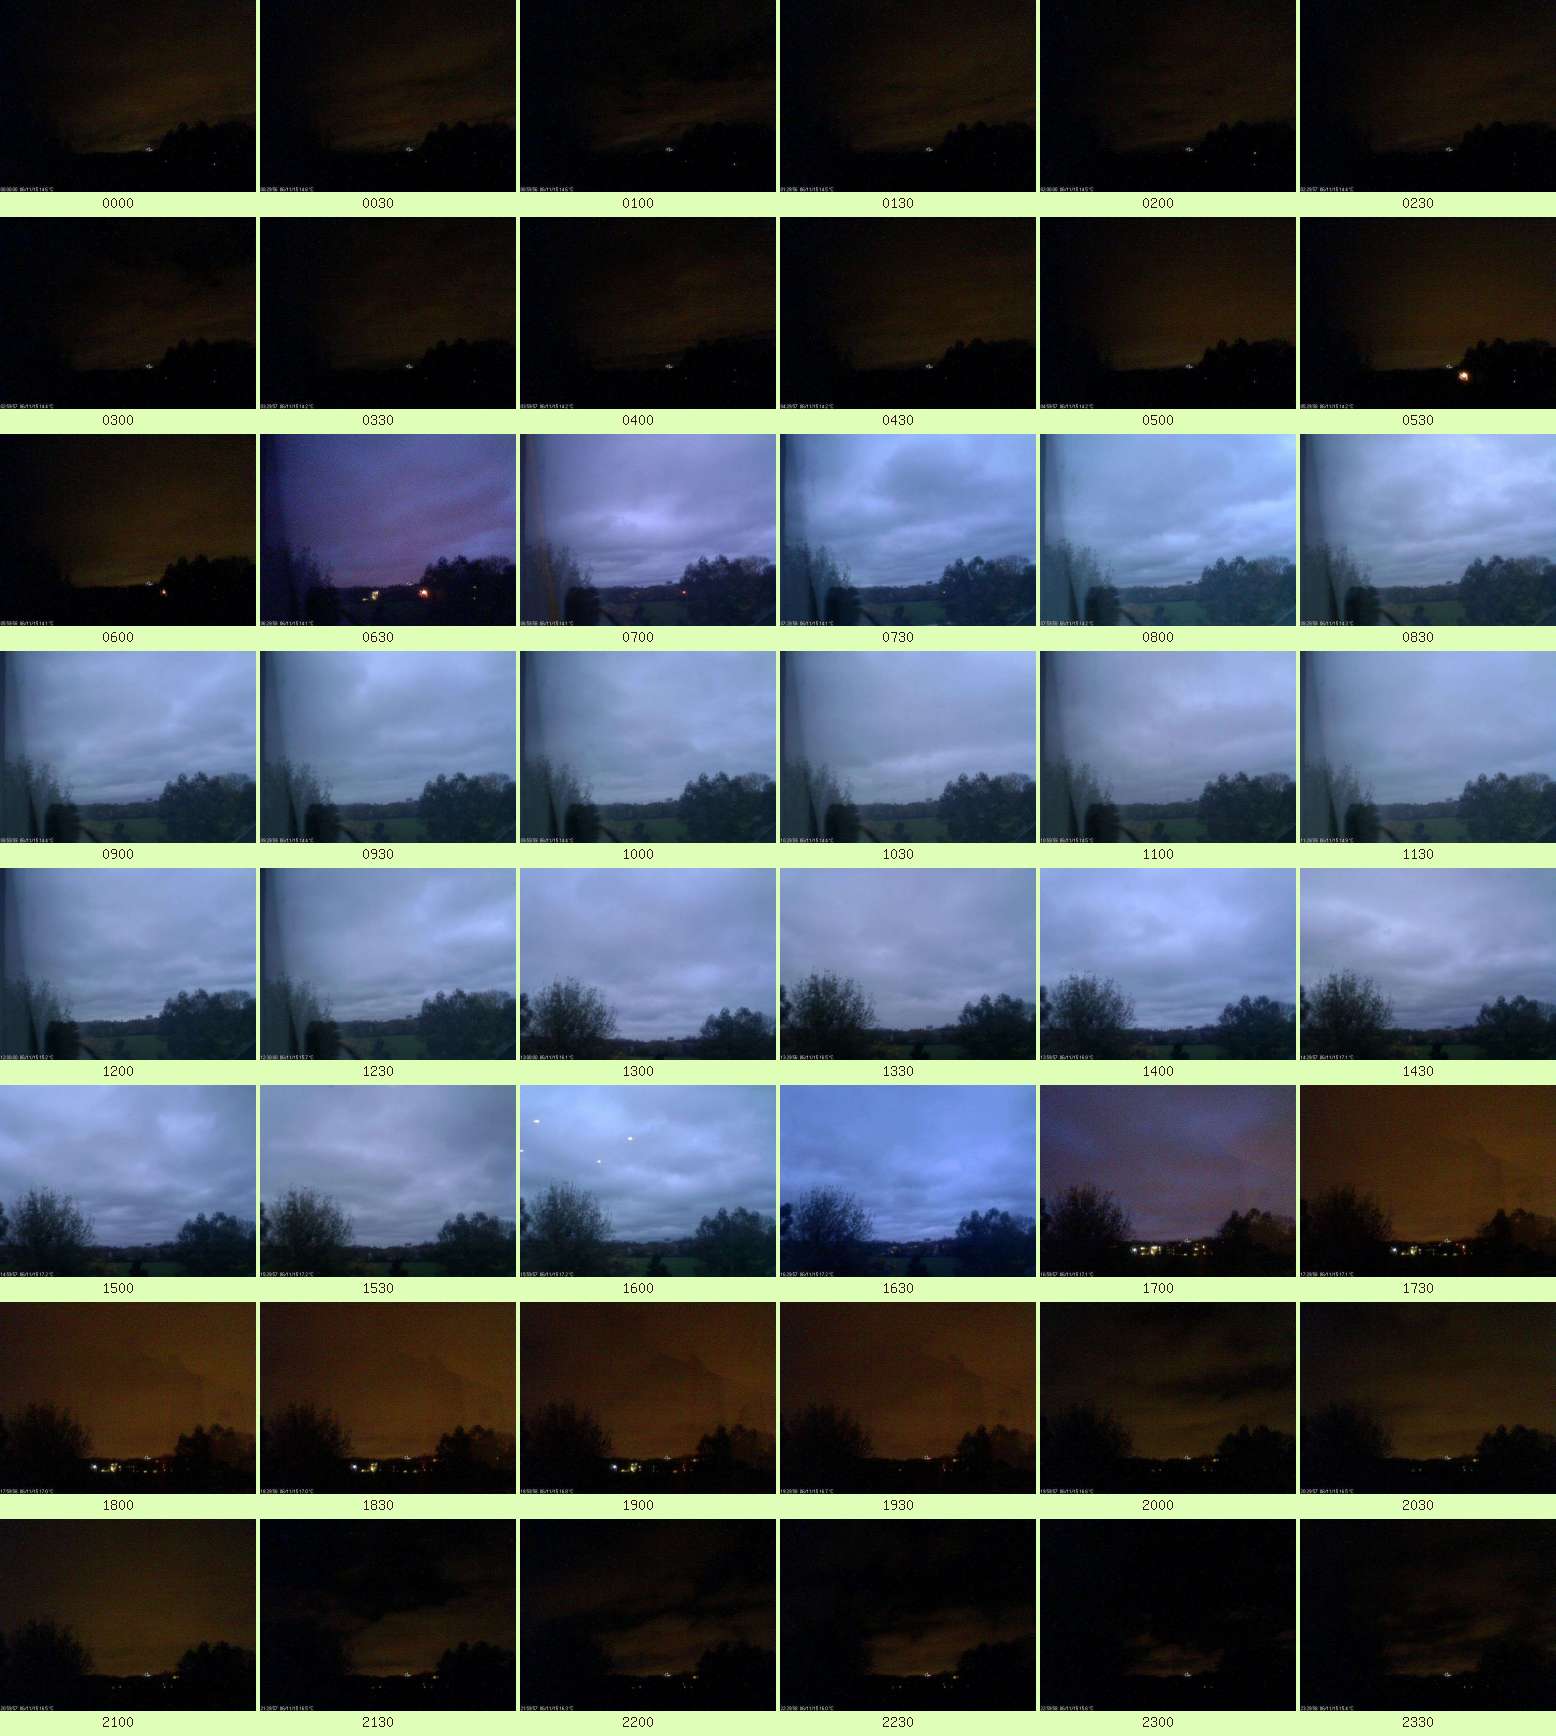