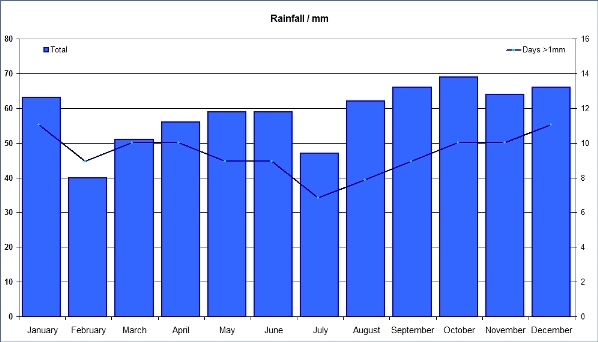
The climate of NW3, much like the rest of London, is a function of its proximity to the European continent, positioning close to the North Atlantic and the North Sea, and to some extent the Urban Heat Island effect and London's rather northerly latitude. The direction of the wind (or more precisely the air mass this brings) is largely responsible for which of these sources most influences the day-to-day weather. With the prevailing wind being broadly south-westerly (bringing tropical maritime air), this gives London its climate of consistent rainfall throughout the year, relatively low sunshine hour count and few snow days, as well as a lack of extremes of temperature, those generally coming when the wind switches away from this direction - to the Arctic north or Polar north-east for cold, and to the Continental south or south east for heat. Thunderstorms are not frequent, and generally comparatively weak compared to those of the near continent. Days of strong winds do occasionally occur, and along with the odd short-lived heat wave or icy cold snap, are the only real hazards in NW3, flooding not being a problem to this hilly area of London, home to inner London's highest point (Whitestone Pond, 134 m).
Long-term Climate Averages
These are estimates for the long-term average weather conditions, i.e. the climate, at NW3.
They were derived from data for the period 1971-2000 - the WMO
standard referece period - from nearby official Met Office sites.
(Mostly the one at Whitestone Pond (see above), which although less than a couple of miles away, is some 80 m higher up in terms of elevation.)
Some adjustments have therfore been made to reflect the different siting conditions.
| Temperature / °C | Rain / mm | Wind Speed / mph |
Days Of | Days Of Snow | Sun Hours | Max Possible Sun Hours | % of Max | ||||||||
| Min | Max | Mean | Range | Rainfall | >1mm Days | Air Frost |
Thunder | Lying | Falling | ||||||
| January | 2.4 | 7.0 | 4.7 | 4.6 | 63 | 11 | 5.2 | 7 | 0.4 | 2.5 | 5 | 46 | 233 | 20% | |
| February | 2.2 | 7.6 | 4.9 | 5.4 | 40 | 9 | 5.1 | 7 | 0.3 | 2.5 | 5 | 75 | 249 | 30% | |
| March | 3.6 | 10.4 | 7.0 | 6.8 | 51 | 10 | 5.2 | 3 | 0.6 | 0.4 | 4 | 105 | 331 | 32% | |
| April | 5.0 | 12.8 | 8.9 | 7.8 | 56 | 10 | 4.9 | 1 | 1 | 0.2 | 2 | 137 | 376 | 36% | |
| May | 8.3 | 16.7 | 12.5 | 8.4 | 59 | 9 | 4.7 | 0.1 | 2 | 0 | 0 | 190 | 440 | 43% | |
| June | 11.1 | 20.2 | 15.7 | 9.1 | 59 | 9 | 4.4 | 0 | 3 | 0 | 0 | 191 | 452 | 42% | |
| July | 13.4 | 22.4 | 17.9 | 9.0 | 47 | 7 | 4.3 | 0 | 2 | 0 | 0 | 185 | 454 | 41% | |
| August | 13.2 | 22.2 | 17.7 | 9.0 | 62 | 8 | 4.0 | 0 | 3 | 0 | 0 | 182 | 410 | 44% | |
| September | 11.1 | 18.7 | 14.9 | 7.6 | 66 | 9 | 3.9 | 0 | 2 | 0 | 0 | 138 | 342 | 40% | |
| October | 8.8 | 14.6 | 11.7 | 5.8 | 69 | 10 | 4.1 | 0.2 | 1 | 0 | 0 | 106 | 295 | 36% | |
| November | 5.0 | 10.2 | 7.6 | 5.2 | 64 | 10 | 4.6 | 2 | 0.4 | 0.3 | 1 | 68 | 237 | 29% | |
| December | 3.2 | 7.8 | 5.5 | 4.6 | 66 | 11 | 5.1 | 6 | 0.3 | 1 | 3 | 48 | 219 | 22% | |
| Winter | 2.6 | 7.5 | 5.0 | 4.9 | 169 | 31 | 5.1 | 20 | 1 | 6 | 13 | 169 | 701 | 24% | |
| Spring | 5.6 | 13.3 | 9.5 | 7.7 | 166 | 29 | 4.9 | 4.1 | 4 | 0.6 | 6 | 432 | 1147 | 38% | |
| Summer | 12.6 | 21.6 | 17.1 | 9.0 | 168 | 24 | 4.3 | 0 | 8 | 0 | 0 | 558 | 1316 | 42% | |
| Autumn | 8.3 | 14.5 | 11.4 | 6.2 | 199 | 29 | 4.2 | 2.2 | 3 | 0.3 | 1 | 312 | 874 | 36% | |
| Sum | 702 | 113 | 26 | 16 | 7 | 20 | 1471 | 4038 | 36% | ||||||
| Annual | 7.3 | 14.3 | 10.8 | 6.9 | 59 | 9 | 4.6 | 2.2 | 1.3 | 1 | 1.6 | 123 | 337 | 36% | |
| Range | 11.2 | 15.4 | 13.2 | 4.5 | 29 | 4 | 1.4 | 7 | 3 | 2.5 | 5 | 145 | 235 | 62% | |
A day-by-day progression of the temperature averages can be found here.
 |
 |
 |
 |
 |
 |