

Site Blog and Weather Station news/updates
New high-res webcam
Last week during a trip back home to London I took the opportunity to upgrade my weather webcam.
I bought a Hikvision DS-2CD2055FWD-I IP camera (4mm focal length), which has an enormous resolution of 3072*2048 compared to
the meager 640*480 of my current 8-year old webcams. This is an incredible 20 times more pixels (6MP vs 0.3MP).
In fact, the resolution is so high, I've had to scale the images down to fit on the website.
I'm incredibly pleased with the quality of the images too, and the camera also gives very good nighttime images.
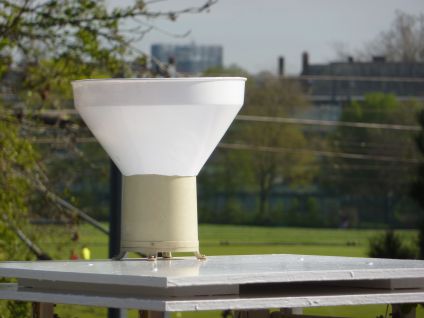
I've been busy this week configuring the camera, setting it up to transmit images to my server, and updating my webcam scripts and web pages to handle the new images. Work is mostly complete on that, but some parts will be finished in the following week or so. One exciting new aspect of this camera is that I've set it up to produce images every 10 seconds (the old cams are every minute), so now we can see the weather in close to real-time. I may even boost that to every 5 seconds if my server can handle it. Weather station update: all is working great with the new station (almost a year in). I've given it a clean and finally painted the rain gauge. Plus I planted some flowers in the pot which houses the weather box, to make it look even prettier (pictures below).
By chance today is summer solstice so it's been a great opportunity to test out the new camera.
Here's a comparison to the old camera.
Weather station looking pretty:
Summer solstice morning timelapse from the new camera: Posted: 21st Jun 2018 |
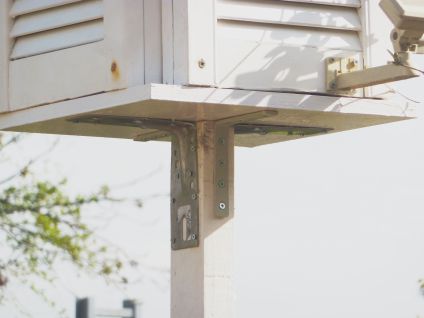
New weather stationAged 18, a near-penniless student with mounting debt, I opted for one of the cheaper models of personal weather stations - Oregon Scientific's WMR-200. It was known to be a little unreliable, but the top-of-the-line brand was more than double the price. Nevertheless, it served me well for the best part of seven years, and I had learned to tolerate its many quirks and frequent issues maintaining connection to the wireless sensors. Leaving the UK in 2015 made things even more difficult, as operating and maintaining an aging, unreliable piece of kit remotely proved challenging. My on-site assistant was able to perform basic repair with over-the-phone instructions, but keeping everything running smoothly proved impossible as the sensors started failing more frequently. Well eight years later, a working man, I could finally afford that more expensive brand, so I bought a Davis Vantage Pro 2 personal weather station and scheduled a trip home to install it. It was long-overdue; two out of the three outdoor sensors had failed (wind in Feb '16 and rain in March '17), and the other (temperature/humidity) having failed and been replaced a year ago. Last weekend I was finally able to completely replace the entire weather station before it collapsed completely. After a few weeks of planning in July, I bought the new station and plotted a strategy for the two days I would have to install it. The weather gods were largely on my side and produced a spell of dry weather on Sat and Sun, enabling a successful and largely smooth installation (plus a full clean and repaint of the radiation shield). By 9pm on Sunday 4th Sep 2017, the new station was operational and sending data to this website, and the old, now crumbling station of nearly 9 years operation was discarded. This new hardware should be more reliable and offer more accurate data due to higher quality sensors and a more advanced data transmission system. Key advantages over the old Oregon Scientific WMR-200 station:
Finally I'd like to thank my weather assistant for her years of help, and ongoing support keeping the station operational. Additional thanks to my sisters for helping with the installation and tolerating the flies & spiders crawling around the old sensors. I'm also grateful to my aunt for lending me tools essential to completing the job. Special thanks are due to the owners of the weather stations I used for wind, rain, and sometimes temperature data whilst my own sensors were failing me: Harpenden weather, UCL casa, and N16 weather. Photos of the installation process and of the new weather station are in a new photo album. Favourites below: Posted: 6th Sep 2017 |
More data downtime - Temperature & HumidityOn 4th Sep the thermo/hygrometer (combined temperature and humidity sensor) failed. It had been suffering a lot lately, but this time it really was dead, and my (proxy) efforts to revive it failed. I bought a new sensor and my weather assistant kindly installed it for me (thanks, mum!). Temperature data was back after its longest absence in over 7 years running this weather station. Phew. What a time to lose data though - on 13th Sep London recorded its hottest September day in 100 years! The value from the proxy station I use was an impressive 32.2 C, which would be my 5th hottest ever. Although the data is likely similar to what mine would have been, I can't say for sure, and overnight temperatures are certainly a bit higher there (UCL, Bloomsbury, central London). Unfortunately the wind sensor is still broken and due to the difficulty of replacing that, I won't be. However, I do want to continue running this station (remotely, with the help of my on-site assistant) for as long as possible. I'm currently investigating other weather stations that might be more reliable, and all being well I would like to have a new one installed by the end of 2017. Posted: 17th Sep 2016 |
Recent live data downtimeAs promised, moving abroad brought with it the risk of increased data downtime for the weather station left behind. Just three months after leaving, the wind sensor stopped reporting on the 11th Feb, so I began to serve up data from Harpenden Weather, a nearby weather station with good wind data (wind speeds don't vary much across 50 miles or so). Then, on 12th April, the other two sensors (temp/hum and rain) stopped reporting too, and I thought nw3weather's days were over. I began to serve up temp, hum, and rain data from UCL's weather station in Bloomsbury whilst I tried to think of ways to solve the crisis. At this point nw3weather.co.uk was simply a proxy for data from nearby weather stations; temperature, humidity and rainfall are much more localised phenomenon so even though UCL is only a few miles away, the data can be quite different. On 14th April I was able to call home and my weather assistant kindly followed my debugging instructions. 15 minutes later ALL sensors were functioning again. All it took was a hard reset of the weather console!
|
Moving to New YorkTomorrow I am moving to live in New York. However my beloved weather station is staying here in nw3 in the care of my family. The impact of this to my dear fans should be minimal during normal operation, but please be aware that any problems which arise may take much longer to resolve. Sadly the art of weather station maintenance is not easy to teach and I have failed to adequately prepare anyone in the UK to deal with potential issues. Thankfully software problems are generally easy to resolve remotely, or with a quick call home. In all likelihood, though, if anything serious were to happen such as a hardware failure then I would be unable to fix the problem until I returned to the UK to visit.
The other impact of my departure is that I won't be around to experience the London weather and report on a number of things which require manual observation rather than automated sensors.
Despite my absence, however, I fully expect to be able to run the weather station in much the same way as I did whilst I lived here.
After all, when I first set it up I was often away from London for months at a time whilst studying at university. P.S. This is why I moved the weather server and webcams to the loft last weekend (they were previously in my bedroom, which is no longer mine). Summary: I'm moving abroad but the station and site are staying put and will be unaffected unless disaster strikes. Posted: 7th Nov 2015 |
nw3weather joins twitter
After experimenting with various ways of sharing interesting stats about the weather that this
station records, I've decided for now that using Twitter is the best way. It is easy to reach a
wide audience and very easy to post text updates and photos. I plan to use it for sharing both stats
("today was the warmest in 18 months") and station issues ("webcam not working"). Also photos I hope.
I'm not convinced by the 140 character limit, which I generally find annoying as I have to resort to
trimming short what I want to say or reverting to text speak or poor grammar. However, I will try it out.
Link to nw3weather's twitter page P.S. The 2014 annual weather report has been archived here Posted: 3rd Oct 2015 |
The weather station (and me) in the Ham and High, 30th Oct 2014
After the record rainfall (for this station) on 13th October 2014, I was contacted by
someone at the local paper, the Ham and High, for an interview about the significance
of the event. Pictures of me looking silly with my manual rain gauge were taken and
the interview was done, but they ended up not using my contribution for that piece.
They did, however, run a entirely different piece just about me and the weather station,
following a further, more personal, interview some days later.
Here it is!
 I thought they were stretching it a bit thin calling me a storm chaser...
Posted: 16th Nov 2014 |
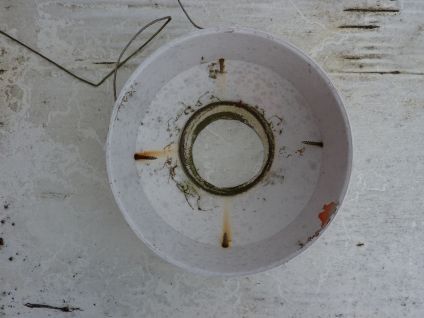
Weather station maintenance / minor upgradeAfter almost five years of constant weathering, the radiation shield for the thermo/hygro sensor was showing serious signs of decay. To remedy this, the base and roof have both been replaced; the body itself seems to be in reasonable enough condition to survive another few winters at least, but has been thoroughly cleaned to maintain its reflective gloss. The rain gauge has also been cleaned out, having built up a considerable layer of moss and dead insects within its internals. In addition to this maintenance, I have replaced the rain gauge collection funnel with another of a larger diameter (25 cm, up from 19.5 cm), thus increasing the gauge's resolution from approx. 0.30 mm to 0.18 mm. The consequences of this change are:
So, good news all around. However, the sensors themselves are showing signs of wear and will probably need replacing next year. Or perhaps I'll replace the entire weather station with a newer and better model. Either way, more weather hardware upgrades to come in 2015 (along with the website upgrades)!
Before: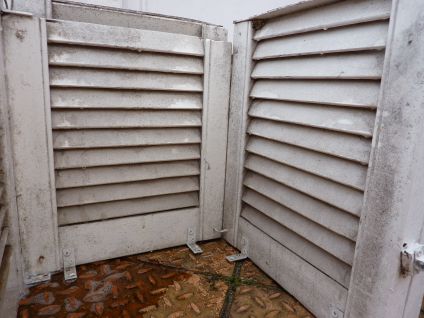 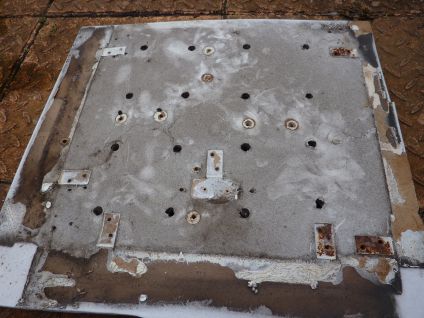
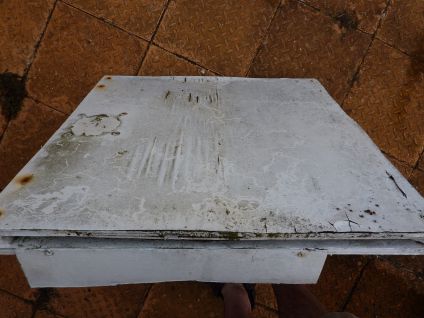 
After: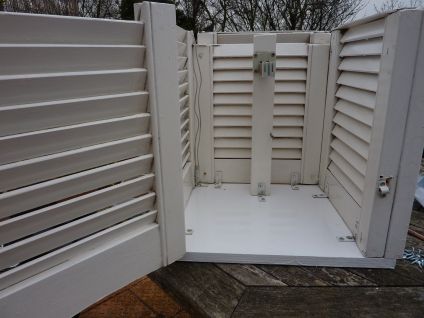 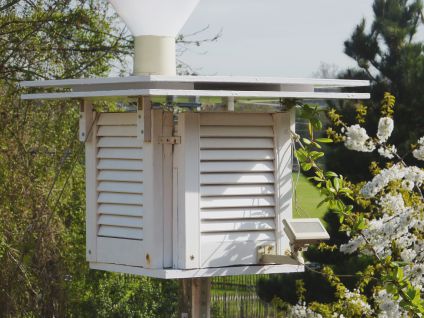
A full photo album has now been published Posted: 30th Mar 2014 |
Source code release and latest website development plans
All source code is now available on GitHub, organised by site version.
This next iteration of nw3weather will initially involve entirely back-end upgrades, of the data model and major refactoring of the source code.
Following the completion of this upgrade in approx. mid-2014, further features will be worked on and test releases to the live site will be
performed before a full live release in 2015, probably. P.S. I will be performing some minor weather station maintenance and upgrades in the spring; detailed information will be posted when this is ready to be undertaken. Posted: 4th Jan 2014 |
Site update - version 3 released
Site v3 has now officially launched!
On account of these fairly significant changes, the loss of a few of the site v2 features, and given that I no longer have any interest in supporting
old (pre-8) versions of Internet Explorer, you may well decide to stick with the old site, version 2. As ever, I will continue to work on improving the site, and welcome suggestions for the next site upgrade. Additionally, feel free to contact me if you think I've unreasonably removed a feature during the upgrade, or you find a bug. Thanks. Finally, be aware that site v3 uses new values for the long-term-average rainfall to reflect recent analysis (see post from 7th Jan 2012 below and the updated xls). Updated values are to be found on the new climate page. The rest of the climate averages will be updated for the start of 2014 to reflect the newly available 1981-2010 standard averaging period. I really hope you all like the changes I've made, and thank you for visiting nw3weather. 
Posted: 22nd May 2013 |
Site update - version 3 released this month
Upgrades to the site are now complete, and site v3 is almost ready to launch.
I'll be doing some testing and final refinements this month, ready for a release on or close to 22nd May.
The changes are fairly minor from a user-perspective, and for the most part I've merely been adding new features. |
Site update - version 3 in development, now available for preview (beta?)I've been working on this on and off since June, but I've come to the realisation that I'm not going
to be able to finish it to a level that's acceptable for a full release this year.
However, I'm releasing site v.3
as a 'beta' (incomplete, potentially buggy, but usable). I'll continue to upgrade, fix, and add new features, so please note that content may change or
disappear from it at any time. Any feature suggestions, reports of problems, or general feedback are all welcome - please use the contact page.
Many pages are unchanged but all have adopted the new look, and server-side graphs has been implemented. |
Weather Station Problems - data downtimeIn the last few months the weather station console, which receives data from the sensors wirelessly, has been dropping the link to these sensors with increasing frequency. Yesterday's downtime was the longest so far and unusually affected all sensors; mostly it is just the wind sensor that drops out. A manual reset was required to solve the problem. I am beginning to wonder whether the console may be failing, so further periods of downtime seem likely, and I may have to replace it, at surprisingly considerable cost; in fact I may well buy a complete new weather station in the summer should problems persist. I have owned and operated the station for almost three years. As a side note, all data that gets lost in these periods of downtime is usually reconstructed using data from other weather stations in London, principally the nearest - at Whitestone Pond. Periods of downtime are easily discerned from the graphs, which show either 'flatline' (wind data) or clear evidence of interpolation (temp, hum data). Yesterday's (15z-23z) is a prime example:  NB: The graph page can be used to check for recent downtime; old graphs are archived here.
Posted: 8th Jan 2012 |
Rainfall Figures - adjustments to correct possible under-readingEarly in 2011 I suspected that the electronic rain gauge may be under-reading, so I decided to set up a manual rain gauge that could be used to check the performance of the automatic one. Suspicion arose due to conflicting figures with an "official" Met Office-standard weather station at Whitestone Pond, about 2km away. On completion of the set-up of a traditional rain gauge in September 2011, manual rainfall data collection began, and the figures compared to my automatically-recorded rainfall. As of December 2011, early results from comparing the data from the two rain gauges suggested a correction of +5% was needed on the automatic one, which was implemented for the start of 2012. Further data will be collected in 2012, with a final correction to be decided on for the start of 2013.
In January 2012, I made a full comparison of rainfall data collected here versus figures from the Whitestone Pond station, as well as a few others around London.
The results are available as a .gif and as the original .xls file.
Averaged over the available timeframe, closest agreement was with the MetO station at RAF Northolt, 15km away but at a similar elevation.
After adjusting for the +5% correction suggested by manual data collection, the figures recorded here are still some 15% lower than those from Whitestone Pond.
However, the agreement of my figures with Northolt's suggest that this is possibly down to elevation difference (55m at NW3weather versus 140m at WS Pond),
since this station is at the bottom of Hampstead Heath whereas WS Pond sits atop the highest point in London.
  Posted: 7th Jan 2012 |
Site News - two new pages, more in developmentWelcome to the NW3weather blog! This is the first of two new pages for the New Year.
The second is a logical addition to the historical reports, annual weather summaries, to compete the set which started with only daily and monthly reports.
A summary section has been added to the monthly weather summaries, though this is not yet finalised.
Furthermore, the daily weather reports page is in need of a complete overhaul to bring it in line with the style of the others, but I've put that on hold for now. |


Updates: The new superscript remains in place in the sidebar for three days after the last blog post. Hover over it to get the date of last posting.