


Annual Summaries
Year 2025 - Warm and very sunny
2025 was the 17th year of records for this weather station.
In Feb I replaced the temp/hum sensor after it was destroyed by a squirrel that took up residence in the radiation shield.
In more positive news, I developed a new sun-counting algorithm based on a model trained on thousands of images from the weather cam,
which has reduced the manual and unreliable toil of the old method of counting sunshine from the daily webcam timelapse.
Here are my weather highlights from the year:
- Mostly dry spring and summer, led to the fewest rainy days for the year on record. 122 vs an avg of 165
- Very sunny, with a record total and above average Mar through Sep (Mar, Jun, Sep were also monthly records)
- Another warm year, just a hair cooler than the record-breaking 2022
- June was the hottest since area records back to 1910, with a mean of almost 20 C
Key averages and extremes
- Temperature
- Mean 12.5 C [+1.1 C from the LTA].
Absolute Min and Max: -4.4 C (Jan 11), and 34.1 C (Jul 1).
Air frosts: 20. Ice days: 0. Days above 30C: 11. - Rainfall
- Total: 578 mm [-6%] across 122 days (33%) of recordable rain.
Highest daily (starting at midnight) total: 36 mm (Jul 19).
Wettest Month: 89 mm [+50%] (Jan). Most rainy: 16 days (Nov).
Driest: 4 mm [-90%] (Mar) on just 2 days, with a total of 5 hours of rainfall
Most rain in an hour: ~26 mm in a Thunderstorm on May 12 - Sunshine
- Total: 1911 hrs [+20] from a possible 4045. (47%)
Days with more than a minute of sunshine: 311 days (87%).
Sunniest month: 260 hrs [+34%] (Jun). Dullest: 59 hrs [-15%] in Jan. - Winter Events
- A couple of cm of lying snow on Jan 5th, and a bit of falling snow on Nov 19.
Website stats
A stable year with no growth. Key data:
- Total sessions: 320k (-1% yoy)
- Mean: 875 per day, Median: 727
- Max: 3.5k on 19 Jul
- Monthly-active users: 7-11k
- Number of tweets: 12 Number of Followers: 290 (-3%) (twitter.com/nw3weather)
- New features: automed sun recording and automated pond temps.
Weather cam timelapse for 2025
See full timelapse archive
These pages are useful for comparing all aspects of the weather across the years .
Updated: 02 Jan 2026Year 2024 - wet, warm, gloomy
2024 was the 16th year of records for this weather station.
In May I replaced the rain gauge with a new 'tipping-spoon' version which has shown greatly-improved accuracy.
I also gave the radiation shield a good clean and new coat of paint, and repaired a broken cable on the wind sensor.
Here are my weather highlights from the year:
- Rainy: wettest year since 2014, with ~30% more than normal. September was the wettest in nw3 since 1974
- Warm again: 2nd warmest of the past 100+ years, after 2022. Overnight temps were an overall record high
- Dull: one of the dullest years in the past 50, with 17% less sun than normal, on par with 2021. 69 days had zero sunshine.
- Snow: barely any. The worst winter since 2014 when there was literally nothing.
- Feb was the warmest in the 100+ year record, by 0.7 C over Feb 1990. The min-temp anomaly (+3.4) was higher than all but Dec 2015 (+5.8)
- June was the best of the summer months, with little rain and lots of sun
- November saw a relentless gloomy spell, the 2nd worst 14-day stretch for Nov in over 100 years
- December was the dullest month since 1969, with just 21 hrs of sun and 15 days with zero sunshine
- May 11th saw the Aurora Borealis come to nw3, lighting up the skies above.
NB: due to the rain gauge replacement noted above, I had to adjust the rainfall amounts from late May onwards downwards versus initial reporting, as a correction I was applying to the old rain gauge no longer applied. Unfortunately I only realised this at the end of the year.
Key averages and extremes
- Temperature
- Mean 12.2 C [+0.8 C from the LTA].
Absolute Min and Max: -4.3 C (Jan 18), and 33.2 C (Aug 12).
Air frosts: 10. Ice days: 0. Days above 30C: 3. - Rainfall
- Total: 795 mm [+29%] across 171 days (47%) of recordable rain.
Highest daily (starting at midnight) total: 27 mm (Sep 23).
Wettest Month: 120 mm [+140%] (Sep). Most rainy: 22 days (Feb).
Driest: 10 mm [-80%] (Jun) on just 6 days, with a total of 16 hours of rainfall
Most rain in an hour: ~17 mm, on the 23rd of Sep - Sunshine
- Total: 1326 hrs [-17%] from a possible 4045. (33%)
Days with more than a minute of sunshine: 297 days (81%).
Sunniest month: 205 hrs [+5%] (Jun). Dullest: 21 hrs [-67%] in Dec. - Winter Events
- A touch of snow on Jan 8th was all.
Website stats
Another good year for organic growth. Key data:
- Total sessions: 324k (+13% yoy)
- Mean: 885 per day, Median: 737
- Max: 2.8k on 23 Sep
- Monthly-active users: ~9000 (+23% yoy)
- Number of tweets: 22 (-2). Number of Followers: 300 (-2%) (twitter.com/nw3weather)
- New features: added historical data back to ~1910 using nearby Met Office sites.
Weather cam timelapse for 2024
See full timelapse archive
These pages are useful for comparing all aspects of the weather across the years .
Updated: 02 Jan 2025Year 2023 - warm and sunny June & Sept, wet end, minimal snow
2023 was the 15th year of records for this weather station.
Here are my highlights from the year:
- Feb was very dry - just 4 mm, a winter month low
- March followed with its wettest, dullest showing, providing more than double its avg rainfall (83 mm) and less half its avg sunshine (40 hrs)
- We broke the record for longest rain-free spell, with a 27 day stretch ending June 11th
- June was consistently warm and sunny, with the highest avg maximum of any June in nw3weather records (24.5 C), and the most sun (253 hrs)
- September had the highest temps of the year, and was overall warmer than July and August
- Dew points in September were very high: we set a new any-month record and all-time high - 22.2 C
- The barometer dipped to a record low in November - 956 mb - as a deep cyclone crossed southern Britain
- December was the warmest winter month since the record-breaking one in 2015, and was warmer than both March and Nov
- Overall temperatures were 0.5 C above the 15-year average, but the average dew point was a record high, 1.6 C above avg
- Rainfall came in a few percent above average and was well distributed but for the dry spells in Feb and May/June.
Key averages and extremes
- Temperature
- Mean 12.1 C [+0.7 C from the LTA].
Absolute Min and Max: -4.9 C (Jan 23), and 31.7 C (Sep 9).
Air frosts: 29. Ice days: 1. Days above 30C: 6. Max feels-like: 40 C. - Rainfall
- Total: 647 mm [+5%] across 159 days (44%) of recordable rain.
Highest daily (starting at midnight) total: 21 mm (Sep 20).
Wettest Month: 94 mm [+45%] (Oct). Most rainy: 23 days (Mar).
Driest: 4 mm [-91%] (Feb). Fewest days: 4 days in Feb, 8 hrs total.
Most rain in an hour: ~14 mm, from a thunderstorm on the 12th of Jun - Sunshine
- Total: 1504 hrs [-6%] from a possible 4045. (37%)
Days with more than a minute of sunshine: 322 days (88%).
Sunniest month: 253 hrs [+31%] (Jun). Dullest than avg: -60% in Mar. - Winter Events
- Minimal. A few cm of snow fell early on Mar 8th and settled. Otherwise a trace of snow on March 6 and 10, and on Dec 1st.
Website stats
Very strong growth this year, no idea why. Key data:
- Total sessions: 287k (+37% yoy)
- Mean: 787 per day, Median: 683
- Max: 2.6k on 02 Nov
- Monthly-active users: ~7000
- Number of tweets: 20 (-18). Number of Followers: 305 (+8%) (twitter.com/nw3weather)
- New features: charts with cumulative rain vs normal, daily temperature vs normal, and monthly variables vs normal.
Weather cam timelapse for 2023
See full timelapse archive
These pages are useful for comparing all aspects of the weather across the years .
Updated: 01 Jan 2024Year 2022 - hot and dry summer, warmest year to date
2022 was the 14th year of records for this weather station.
For a change, there were no changes to the station or website this year.
As for the weather, here are my highlights from the year:
- Record high temperatures in July - peaking at 39.1C, more than 2C above the prior record
- Jan-Jul very dry with about 50% of the average, vs rather wet remainder of the year with every month wetter than average
- Year overall was 1.1C above the 30-year average and the warmest recorded at nw3weather so far
- As of Aug 10 we had the driest trailing 365 day period recorded with just 394 mm. Then in Nov, the wettest 31 days with 170 mm
- December was the only month with below average temperatures (-1.1C). Biggest anomaly was +2.4 in Aug.
- Feb 18 saw red warnings for wind in London and we broke some records with a 64 mph gust and 44 mph sustained wind
- Coldest, snowiest December since 2010, and snowiest of any month since Jan 2013
- On Jan 15 the shockwave from the Tonga eruption showed up in the barometer readings.
Key averages and extremes
- Temperature
- Mean 12.5 C [+1.1 C from the LTA].
Absolute Min and Max: -5.1 C (Dec 15), and 39.1 C (Jul 19).
Air frosts: 20. Ice days: 1. Days above 30C: 10. Max feels-like: 42 C. - Rainfall
- Total: 566 mm [-8%] across 148 days (41%) of recordable rain.
Highest daily (starting at midnight) total: 36 mm (Aug 17).
Wettest Month: 135 mm [+102%] (Nov). Most rainy: 20 days (Nov).
Driest: 2 mm [-95%] (Jul). Fewest days: 4 days in Aug.
Most rain in an hour: ~23 mm, from a thunderstorm on the 17th of Aug - Sunshine
- Total: 1705 hrs [+7%] from a possible 4045. (42%)
Days with more than a minute of sunshine: 312 days (86%).
Sunniest month: 234 hrs [+26%] (Aug). Dullest than avg: -29% in Nov. - Winter Events
- There were 7 days with lying snow, and 2 with falling snow (giving 9 cm worth in aggregate), as well as 222 total hrs when the temperature was below zero, the majority in Dec. The minimum wind chill was -11C on Dec 15.
Website stats
nw3weather returned to growth in 2022. Key stats:
- Total visits: 209k (+14% yoy)
- Mean: 573 per day, Median: 453
- Max: 3.3k on 19 Jul
- Number of tweets: 38 (+3). Number of Followers: 283 (+22%) (twitter.com/nw3weather).
- New features: none this year for nw3weather!
Weather cam timelapse for 2022
See full timelapse archive
These pages are useful for comparing all aspects of the weather across the years .
Updated: 27th Mar 2023Year 2021 - coolest in eight years, severely lacking in sun, fairly wet
2021 was the 13th year of records for this weather station, and the 11th complete year in its current location in nw3.
Aside from the wind sensor which is still broken, despite my efforts to fix it, the station is still going strong.
I moved the weather cam to sit outside the window in direct weather, which has improved the glorious images streaming in.
I also launched a sister station here in the SF bay area, RWC weather.
As for the weather, here are my highlights from the year:
- Cold, wet, dreary January. Coldest since 2017, wettest since 2014, dullest since 2013.
- One freezing week in Feb when there was a 64 hour spell of sub-zero weather and 6 days of means below zero.
- April: cold, sunny, very dry. Coldest in my records and 2.7C below the 30yr normal; 2nd driest in my records with 93% less rain than avg.
- May continued the cold trend (-1.7 vs avg, a record for me), but the rain returned (+60% vs avg) and sun vanished (-32%)
- The summer mostly saw colder than avg days with limited sun, especially in Aug (only 50% of avg and duller than March and Nov!). Early June was nice, and mid July which saw the hottest temp of the year at 31.7 (albeit this was the lowest 7 years).
- Record July rain (168% above avg) was thanks mostly to two very active thunderstorms on the 12th and 25th The first caused local flooding and resulted in record daily rainfall; some areas in Hampstead received over 100mm.
- After the dismal Aug, September was the warmest in 5 years. October was wet for the 3rd year running (+50% vs avg), while November was the driest in my record books (88% below avg) despite seeing some rain on more than a third of the days.
- December was abysmally dull, with just 29 hrs of sun, matching the record low of Dec 2010 (-56% vs avg).
- Overall 2021 was the least sunny in my 13 years of records, the coldest since 2013, and wettest since 2014.
Additionally, at the end of the year I updated the reference period for climate normals from 1981-2010 to 1991-2020, as per standards. The latter period was about 0.5C warmer than the prior one, and marginally wetter. Separately I updated the sunshine averages to fix a bug in my original translation of the Heathrow averages I based them on. Updated values are now on the climate page and used throughout the site.
Key averages and extremes
- Temperature
- Mean 11.3 C [-0.1 C from the LTA].
Absolute Min and Max: -3.9 C (Feb 13), and 31.7 C (Jul 20).
Air frosts: 27. Ice days: 2. Days above 30C: 3. Max feels-like: 39 C. - Rainfall
- Total: 676 mm [+10%] across 159 days (44%) of recordable rain.
Highest daily (starting at midnight) total: 42 mm (Jul 12).
Wettest Month: 123 mm [+168%] (Jul). Most rainy: 19 days (Jan).
Driest: 3 mm [-93%] (Apr). Fewest days: 4 days in Apr.
Most rain in an hour: ~20 mm, from a thunderstorm on the 12th of July - Sunshine
- Total: 1323 hrs [-17%] from a possible 4045. (33%)
Days with more than a minute of sunshine: 294 days (80%).
Days with at least 95% of their maximum possible sun: 19 (5%).
Sunniest month: 200 hrs [+24%] (Apr). Dullest than avg: -56% in Dec. - Winter Events
- There were 6 days with lying snow, and 7 with falling snow (giving 10 cm worth in aggregate), as well as 249 total hrs when the temperature was below zero, the majority in Feb. The minimum wind chill was -12C on Feb 13.
- Wind
- No reliable wind data this year ;(
- Other Events
- There was 1 know days of hail, 5 with thunder (3 Jul, 2 May), and 4 days with dense fog at 9am.
Website stats
nw3weather had no year-on-year growth for the first time in its history... Stats:
- Total visits: 184,398 (-1% over 2020)
- Mean: 503 per day, Median: 435
- Min: 215 on 25 Sep
- Max: 1,552 on 18 Jun
- Number of tweets: 35 (+1). Number of Followers: 220 (+21) (twitter.com/nw3weather).
- New features: none this year for nw3weather, check out rwcweather for new features!
Weather cam timelapse for 2021
See full timelapse archive
These pages are useful for comparing all aspects of the weather across the years .
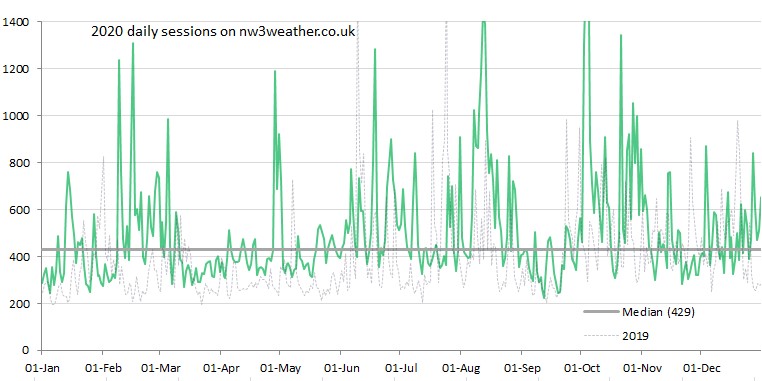
Updated: 5th Jan 2022Year 2020 - warm, v. sunny spring; record October rain; least wintry since 2014
2020 was the twelfth year of records for this weather station, and the tenth complete year in its current location in nw3.
For the first time since I moved to the US in 2015 I was unable to visit nw3 due to lockdowns, and without its regular maintenance the station did have
a few issues. The rain and wind sensors failed, but thankfully with local help I've been able to keep things running (rain gauge fixed, wind sensor soon).
More happily, while stuck at home in northern California, I finally set up a sister weather station here, with a website launch coming in June 2021!
As for the weather, here are my highlights from a warm, sunny year:
- The year began with record January warmth, and near-record Feb warmth; both months 2.6C above average
- Unsurprisingly it was the least wintry year since 2014, with just a single day of snowfall, no lying snow, and a mere 8 air frosts
- Feb was the windiest of any month I've recorded as a whole, and set records for highest gust (58 mph) and windiest day (16 mph)
- The warmth continued into the spring - Apr and May's avg maxima were 4.4 and 3.5 C above avg respectively
- May was exceptionally sunny with 306 hrs - 72% above avg and 69% of the maximum possible! Prior record from Jul 18 exceeded by over 40 hrs
- With sunny months in March, April and Sept too, the year as a whole had it's 2nd highest total, just behind 2018, with 16% more than average
- Rare for nw3, August was the best of the summer months with maxima 2C above avg and a notable heatwave - all days 7th-12th were above 30C and the overnight low on the 12th was a record high of 21.1C
- October was the wettest month I've recorded with 166 mm. More than half of that came in a three day downpour - 2nd-4th
- For the 7th year running, the overall average temperature was above the long-term average. It was the 2nd warmest, just behind 2014.
NB: After extensive analysis of the data from official met office sites at Heathrow and Northolt in west London (my closest two), and updating my long-term-average (LTA) period from 1971-2000 to 1981-2010, I made some small adjustments to the climate averages used on this website. Key changes: avg temp increased slightly, especially nights; rain decreased slightly; winter sun increased modestly. When the official LTA data comes out for 1991-2020 I will update them again, probably in a year from now (the standard practice is for the LTA reference period to update every 10 years and look back at a fixed 30-year period).
Separately I checked my data for possible sensor calibration issues: sun and temp data looks good but rain was too low so I adjusted all 2020 rain totals by +15%. Furthermore I applied an additional +10% ongoing correction to the rain gauge itself, giving a +20% total ongoing correction.
Key averages and extremes
- Temperature
- Mean 12.2 C [+1.3 C from the LTA].
Absolute Min and Max: -1.8 C (31st Dec), and 36.2 C (31st Jul).
Air frosts: 8. Ice days: 0. Days above 30C: 10. Max feels-like: 42 C. - Rainfall
- Total: 640 mm [+6%] across 172 days (47%) of recordable rain.
Highest daily (starting at midnight) total: ~34 mm (3rd Oct).
Wettest Month: 166 mm [+144%] (Oct). Most rainy: 24 days (Oct).
Driest: 5 mm [-89%] (May). Fewest days: 2 days in May.
Most rain in an hour: ~10 mm, from a thunderstorm on the 16th of Aug - Sunshine
- Total: 1730 hrs [+16%] from a possible 4045. (43%)
Days with more than a minute of sunshine: 312 days (85%).
Days with at least 95% of their maximum possible sun: 36 (10%).
Sunniest month: 306 hrs [+72%] (May). Dullest than avg: -36% in Oct. - Winter Events
- There were zero days with lying snow, and just 1 with falling snow (giving 3 cm worth), as well as 8 air frosts [-18] (we had 36 total hrs below zero, the majority in Dec). The minimum wind chill was -7C on Dec 31st.
- Wind
- The maximum wind gust was 58 mph on Feb 9th, and the maximum 1-min-avg wind was 34 mph
The windiest day was the 9th Feb with a mean of 16 mph. Feb was also the windiest month at 8.7 [+3.6 mph]. - Other Events
- There were 2 known days of hail, 11 with thunder (5 in Aug), and 8 days with fog at 9am.
Website stats
nw3weather again experienced strong growth, with traffic up another 21%. Stats:
- Total visits: 184,398 (a 28% increase over 2019)
- Mean: 504 per day, Median: 429 (median lower than mean since busy days - commonly very wet, hot/cold, or snowy days - skew the mean)
- Min: 224 on 12 Sep (a sunny Saturday, the quietest day of the week)
- Max: 1,917 on 04 Oct (last day of a record-breaking three-day rain storm)
- Number of tweets: 34 (+2). Number of Followers: 199 (+45) (twitter.com/nw3weather).
- New features: wind rose graphics for any custom period, including automated daily, monthly, annual generation.
Weather cam timelapse for 2020
See full timelapse archive
These pages are useful for comparing all aspects of the weather across the years .
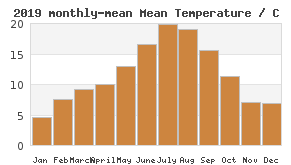
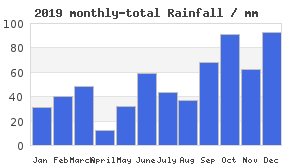
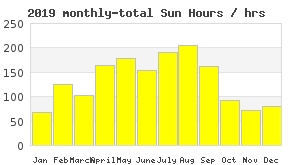
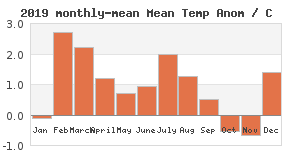
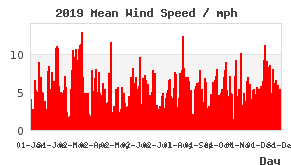
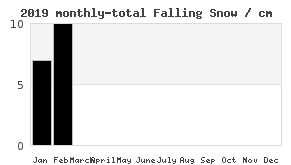
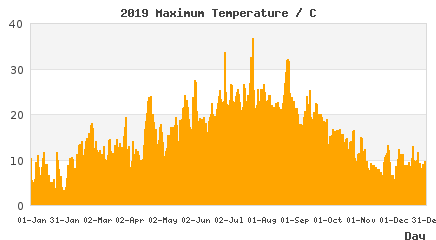
Updated: 14th Jan 2021Year 2019 - Heatwaves in Feb and July, winter sun, soggy Q4
2019 was the eleventh year of records for this weather station, and the ninth complete year in its current location in nw3.
A notable addition to the site this year was pond temperature monitoring - my local assistant (and pond fan)
heads to the Hampstead Heath ponds most mornings to swim and note down the water temperature, which they
then submit to nw3weather so I can display it on the site and also keep a record over the year.
As for the weather, we had plenty of warm, sunny spells, some record breaking heat in July,
and a welcome return of the rain in late September.
My weather highlights:
- The year began with continuing dryness - we hit 16 consecutive days without rain - the longest all year and a winter record
- It was a respectable year for snow with 17cm falling and 5 days with snow on the ground - about average
- Then began a warm spell mid Feb to late March - 3C above average and with only two daytimes colder than average
- The 18.1 C reached on 26 Feb was a winter record. Some London sites hit 20.
- It was a good year for winter sun lovers - Jan, Feb & Dec recorded 50-60% more than normal. Feb's was a record and more than Mar or Oct.
- Summer was warm and sunny overall, for the 2nd year running. July and Aug were ~2C above average
- Most notable was the record-breaking heatwave in late July and new record maximum of 36.8 C on the 25th
- By mid-Sept we were running a ~30% rainfall deficit, but this all changed by month's end and all four of the final months were wetter than avg
- Notable rainfall of ~30 mm on Sep 24th sadly coincided with a malfunction of my rain sensor; soon fixed!
- There were 26 days with measurable rain in Nov, bested in the past 10 years only by Jan 2014
- Oct and Nov were the only months with below average temperatures, and only by half a degree.
NB: After extensive analysis of rainfall data across three official met office sites in London, I determined that my new weather station, installed in Sep 2017, was miscalibrated. Accordingly, on 10th Jan 2020 I adjusted all rainfall data by +10% since then. With this correction 2019 ended up with average rainfall.
Summary of Data
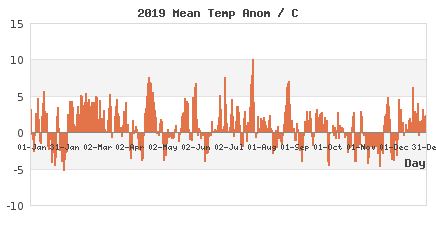
- Temperature
- Mean 11.7 C [+1.0 C from the LTA].
Absolute Min and Max: -4.6 C (31st Jan), and 36.8 C (25th Jul).
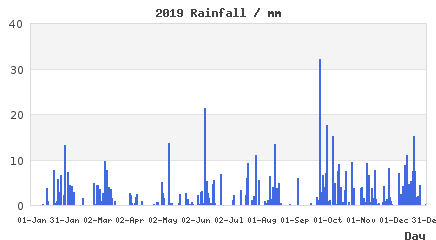
Air frosts: 14. Ice days: 0. Days above 30C: 7. Max feels-like: 45 C. - Rainfall
- Total: 618 mm [-1%] across 174 days (48%) of recordable rain.
Highest daily (starting at midnight) total: ~32 mm (24th Sept).
Wettest Month: 93 mm [+65%] (Dec). Most rainy: 26 days (Nov).
Driest: 12 mm [-75%] (April). Fewest days: 9 days in Feb.
Most rain in an hour: ~11 mm, from a thunderstorm on the 1st of Oct - Sunshine
- Total: 1594 hrs [+8%] from a possible 4045. (39%)
Days with more than a minute of sunshine: 314 days (86%).
Days with at least 95% of their maximum possible sun: 32 (9%).
Sunniest month: 205 hrs [+13%] (Aug). Most sunnier than avg: +66% in Feb. Dullest than avg: -19% in June. - Winter Events
- There were five days with lying snow (max: 5 cm on 1st Feb), and 4 with falling snow (giving 17 cm worth), as well as 14 air frosts [-12] (we had 84 total hrs below zero, the majority in Jan). The minimum wind chill was -7C on Feb 1st.
- Wind
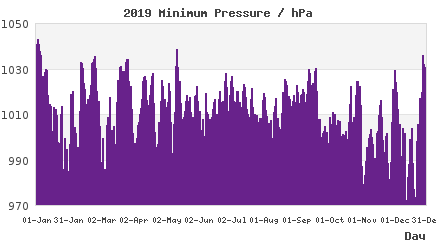
- The maximum wind gust was 48 mph on Aug 10th, and the maximum 1-min-avg wind was 32 mph
The windiest day was the 16th of Mar with a mean of 12.8 mph. March was also the windiest month at 6.4 [+1.2 mph]. - Other Events
- There were 0 known days of hail, 7 with thunder (4 in Jul), and 7 days with fog at 9am.
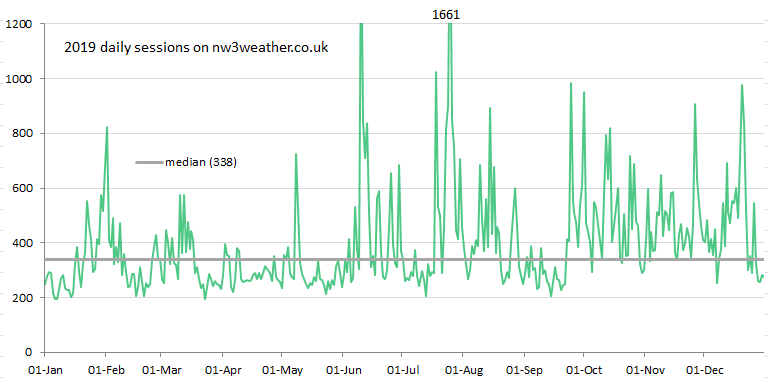
As for website traffic, nw3weather again experienced strong growth, with traffic up another 21%. Strong Q4 thanks to the rain. Stats:
- Total visits: 143,609 (a 21% increase over 2018)
- Mean: 393 per day, Median: 338 (median lower than mean since busy days - commonly very wet, hot/cold, or snowy days - skew the mean)
- Min: 193 on 23 Mar (a dull Saturday, the quietest day of the week)
- Max: 1661 on 25 Jul (a day of record-breaking heat)
- Number of tweets: 32 (+1). Number of Followers: 154 (+26) (twitter.com/nw3weather).
Weather cam timelapse for 2019
See full timelapse archive
These pages are useful for comparing all aspects of the weather across the years .
Updated: 10th Jan 2020Year 2018 - 'beast from the east', a real summer, plentiful sun, new hardware
2018 was the tenth year of records for this weather station! (and the eighth complete year in its current location in nw3).
In June I installed a new high-resolution IP web camera (20x more pixels than the current),
and added functionality to the site providing daily, monthly and annual timelapses from the footage.
This year also saw the death of my local weather server PC, which mysteriously and catastrophically shut down for good in late September. From across the Atlantic, I scrambled to find a replacement and within two weeks a new micro PC was up and running, thanks to the heroic efforts of my onsite assistant, who declared setting it up as "the hardest thing I have ever done". To be fair, we didn't have a working keyboard, so I had to explain over the phone how to use the on-screen keyboard to install remote access software so I could take over and complete the setup.
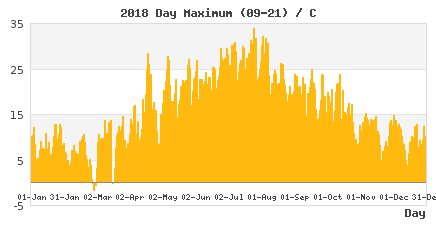
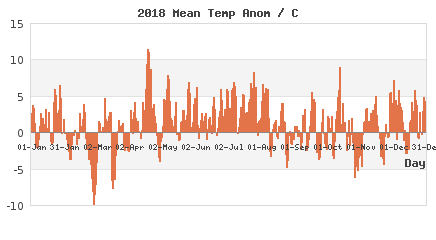
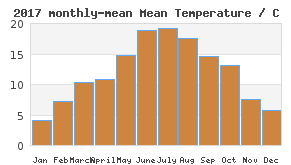
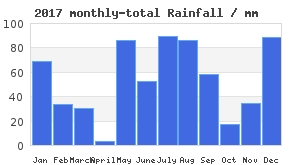
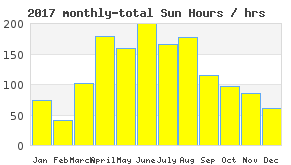
And the weather itself? Drier and warmer than average, with a stand out summer (hot, dry, sunny) and notably cold late winter spell. It was also by far the sunniest year I've recorded. My weather highlights:
- Late Feb into March saw a powerful cold snap bring our coldest day on record (-4.1C) and a spell of sub-zero weather lasting over 100 hours
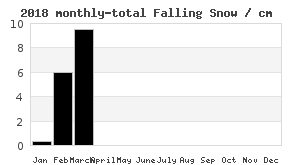
- Snowiest year since 2013, with 8 days of snow on the ground and 16cm total snowfall
- March had 52% above avg rainfall, with rain on 23 days; both new records for that month
- The 19th of April was the hottest April day at 28.4C, and over 15C above average, a record anomaly
- June was the driest month on record, with only 0.8mm of rain (99% below average), from 4 separate days each with under an hour of rainfall
- July was the warmest month I've recorded, 3.8C above average, with a daily mean high of 27.2C
- July was also the sunniest month I've recorded, 42% above avg, with daily sun averaging 8.5 hrs
- Summer as a whole, especially mid June to early Aug, was hot, dry & sunny; most notable was how long those conditions lasted
- Experienced our oldest October night on record, -0.8 C
- We had ~15% less rain than average (driest since 2011), and no month had more than 70 mm (a first)
- It was the fifth consecutive year with above average temperatures (+1.3C, same as 2017). Only Feb and March were colder than avg
- The year as a whole was by far the sunniest year I've recorded, with 18% more than average.
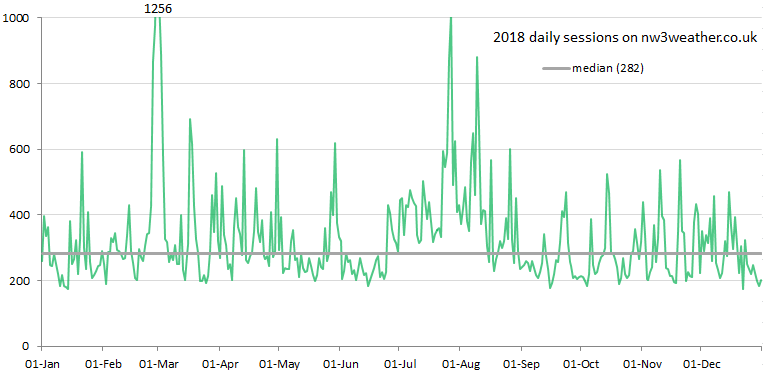
As for website traffic, nw3weather again had its busiest ever year since launching in Sep 2010. Stats:
- Total visits: 118,259 (a 21% increase over 2017; was 2018 more interesting weather-wise?)
- Mean: 324 per day, Median: 282 (median lower than mean since busy days - commonly very wet, hot/cold, or snowy days - skew the mean)
- Min: 173 on 22nd Dec (a Saturday, the quietest day of the week)
- Max: 1256 on 28th Feb (snowy with record-breaking cold)
- Number of tweets: 31. Number of Followers: 128 (twitter.com/nw3weather).
Additionally, to support the new volume of image and video data from the IP cam (I now store snapshots every 5 minutes, along with the daily timelapses), I increased the storage of the web server to 75 GB. I expect to need an extra 25 GB per year.
Summary of Data
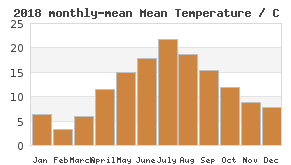
- Temperature
- Mean 12.1 C [+1.3 C from the LTA].
Absolute Min and Max: -5.4 C (28th Feb), and 33.9 C (26th Jul).
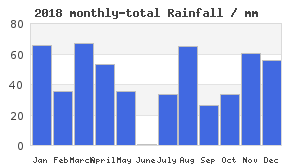
Air frosts: 23. Ice days: 4. Days above 30C: 12 - Rainfall
- Total: 530 mm [-15%] across 145 days (40%) of recordable rain.
Highest daily (starting at midnight) total: 17 mm (10th Nov).
Wettest Month: 67 mm [+52%] (Mar). Most rainy: 23 days (March again).
Driest: 0.8 mm [-99%] (June) across just 4 days of rainfall.
Most rain in an hour: 12.2 mm, from a thunderstorm on the 13th of July - Sunshine
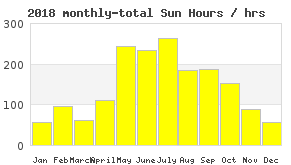
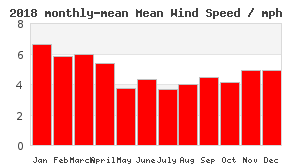
- Total: 1734 hrs [+18%] from a possible 4045. (42%)
Days with more than a minute of sunshine: 305 days (84%).
Days with at least 95% of their maximum possible sun: 39 (11%).
Sunniest month: 263 hrs [+42%] (July). Most sunnier than avg: +44% in Oct. Dullest than avg: -41% in Apr. - Winter Events
- There were eight day with lying snow (max: 6 cm on 1st March), and 8 with falling snow (giving 16 cm worth), as well as 23 air frosts [-3] (218 hrs below zero, the majority in Feb & March). The minimum wind chill was -15C on Feb 28th.
- Wind
- The maximum wind gust was 50 mph on Jan 3rd, and the maximum 1-min-avg wind was 31 mph
The windiest day was the 3rd of Jan with a mean of 12.6 mph. Jan was also the windiest month, [+1.1 mph]. - Other Events
- There were 0 known days of hail, 9 with thunder (4 in May), and 0 known days with fog at 9am.
Weather cam timelapse for 2018
See full timelapse archive (high-res cam available 20th Jun onwards)
These pages are useful for comparing all aspects of the weather across the years .
Updated: 7th Jan 2019Year 2017 - warm spring, wet summer, snow returns
2017 was the ninth year of records for this weather station, and the seventh complete year in its current location in nw3.
On the whole, it was another warm year, with average rain and sun.
The big news this year was that I completely replaced the weather station with an upgraded model: A Davis VP2, in early Sept. So far it's been working great!
Weather Highlights:
- Exceptional and extended Spring warmth: From late Feb to late Jun the mean temperature was 2.5C above the long-term average
- June was the warmest ever, and included a record 5 day spell of maximum temperatures above 30C
- For the 2nd year running, no month was more than 0.5C below average
- Bone-dry April: Bested only by April 2011's 2mm, the 3mm in April '17 is our 2nd driest month ever, and just 6% of the expected total
- Wet summer: Average rainfall for May-Aug was 56% above average (mostly due to several big falls). A welcome change after April
- Interestingly, the year had only 145 days with measurable rain, a record low, despite the total rain being 6% above avg
- Sunny January: Fourth year in a row above average, and included 4 days having their maximum possible sunshine
- On the 10th Dec we had our first substantial snow in five years, with a nice 4cm covering.
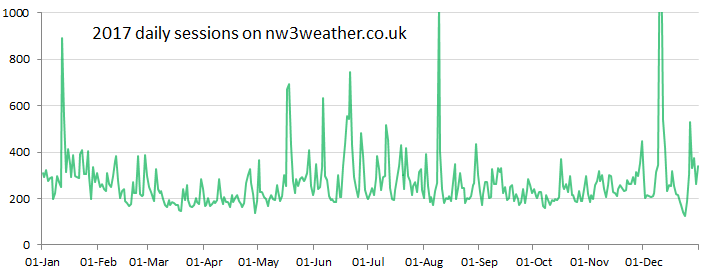
For the website, nw3weather again had its busiest ever year since launching in Sep 2010. Stats:
- Total visits: 98,075 (a 16% increase over 2016, and double the 2012 total)
- Mean: 269 per day, Median: 240 (median lower than mean since busy days - commonly very wet, windy or snowy days - skew the figure)
- Min: 126 on Christmas Eve (an overcast, dry, warm and unremarkable winter day)
- Max: 1486 on 10th Dec (Snow Day!)
- No. tweets: 25. No. Followers: 69 (twitter.com/nw3weather).
Summary of Data
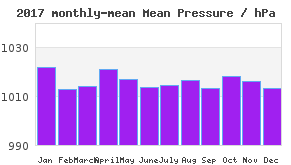
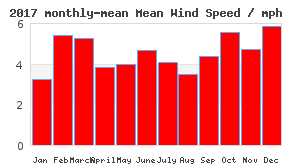
- Temperature
- Mean 12.0 C (+1.3 C from the LTA). Absolute Min and Max: -3.6 C (22nd Jan), and 33.0 C (21st Jun).
- Rainfall
- Total: 648 mm (+4%) across 145 days (40%) of recordable rain.
Highest daily (starting at midnight) total: 39 mm (9th Aug).
Wettest Month: 89 mm [+112%] (Jul). Most rainy: 20 days (Feb).
Driest: 3 mm [-94%] (Apr) across just 4 days of rainfall. - Sunshine
- Total: 1454 hrs (-1%) from a possible 4045. (36%)
Days with more than a minute of sunshine: 301 days (82%).
Sunniest month: 200 hrs [+5%] (Jun). Most sunnier than avg: +62% in Jan - Winter Events
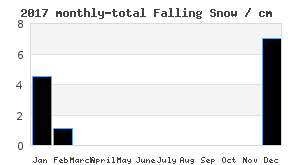
- There were three day with lying snow (max: 4cm on 10th Dec), and 6 with falling snow, as well as 21 air frosts [-5] (133 hrs below zero).
- Other Events
- There were 2 days of hail, 1 with thunder (11th Sep), and 4 with fog at 9am.
Weather cam timelapse for 2017
These pages are useful for comparing all aspects of the weather across the years .
Updated: 15th Jan 2018Year 2016
2016 was the eighth year of records for this weather station, and the sixth complete year in its current location in nw3.
Highlights:
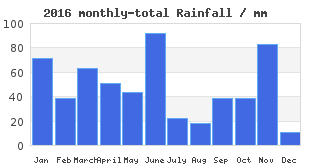
- December rainfall: 81% below average, third driest month on record, and first time the driest month of the year was a winter month
- Very wet, stormy, dull June - 67% up on rain, and just half the expected sunshine. 7 days had thunder, a record
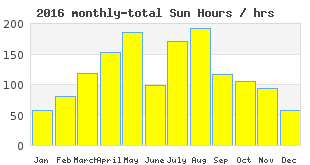
- Winter sunshine: Jan, Feb, Dec and Nov were all sunnier than average
- Foggy December: 7 days, a record (previous was 3 in Nov' 11), helping achieve a record year with 10 foggy days
- Late April cold: The last week of April was > 3C below avg and had a couple of snow showers (the latest seen at nw3weather)
- Anomalous overall warmth: 7 out of 12 months were > 1C above avg, and the lowest anomaly was just -0.5C (a record)
- September was warmer than June, and only a degree cooler than Jul/Aug, followed by a 6 deg drop into Oct
The weather station itself had a bad year, the wind sensor failing in early Feb (not yet fixed), and multiple outages of the thermo/hygro sensor (ranging from a few hours to a few days); indeed this was replaced in late Sep. This coming year I plan to replace the entire weather station, probably in September.
For the website, nw3weather just about saw its busiest year since launching in Sep 2010. Stats:
- Total visits: 84,738 (just 0.7% / 600 more than 2015)
- Mean: 232 per day, Median: 213 (median lower than mean since busy days - commonly very wet, windy, hot or cold days - skew the figure)
- Min: 121 on Christmas Day (a dull, warm, unremarkable winter day)
- Max: 813 on 23rd June (EU referendum day, though also a very wet, stormy day)
- No. tweets: 52 (twitter.com/nw3weather)
Summary of Data
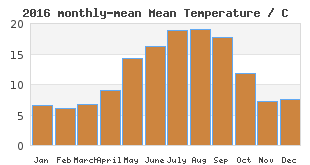
- Temperature
- Mean 11.7 C (+1.0 C from the LTA). Absolute Min and Max: -3.5 C (19th Jan), and 32.6 C (19th Jul).
- Rainfall
- Total: 570 mm (-9%) across 161 days (44%) of recordable rain.
Highest daily (starting at midnight) total: 30 mm (23rd Jun).
Wettest Month: 92 mm [+67%] (Jun). Most rainy: 23 days (Jan).
Driest: 11 mm [-81%] (Dec) across 8 days of rainfall. - Sunshine
- Total: 1426 hrs (-3%) from a possible 4045. (35%)
Days with more than a minute of sunshine: 311 days (85%).
Sunniest month: 192 hrs [+5%] (Aug). - Winter Events
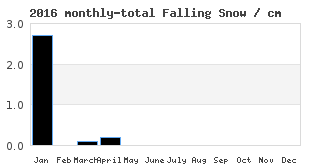
- There was one day with lying snow (1cm on 17th Jan), and 5 with falling snow, as well as 16 air frosts (-10).
- Other Events
- There were 2 days of hail, 13 with thunder (7 in Jun), and 10 with fog at 09z (7 in Dec).
These pages are useful for comparing all aspects of the weather across the years .
Updated: 1st Jan 2017Year 2015
2015 was the seventh year of records for this weather station, and the fifth complete year in its current location in nw3.
Generally unremarkable when averaged over the entire year (temperature +1.1C, rain -5%, sun -2%), 2015
will nonetheless be remembered for its quite spectacular December. The heights reached by the daily night and day
temperatures are impressive enough, but most remarkable and unusual was the sheer persistence of the warmth:
- Mean temperature, 11.5C (10C by night, 13C by day)... +6C above the LTA average of 5.5C
- Highest temperature by day: 16.0C (winter month record)
- Highest temperature by night: 14.1C (record for any month between Dec-Apr)
- EVERY day hit at least 10C (consider that the AVERAGE December high is only 7.8C)
- NO night fell below 4.7C (the AVERAGE December low is 3.2C)
- The previous December record for mean temp of 7.1C was bested by over 4C
- Five years ago the mean temp was 1.3C, 10C lower than this year
- The mean overnight temperature, 10C, was higher than ANY May month on record
- All but two of the 20 highest December temperatures in the last seven years, and all of the top 13, came in 2015
- It was significantly the most anomalous for temperature in 84 months on record, at +6.0C. Previous record was +4.7C in Apr 2011
Also worth a note is the wind speed, which averaged over the year was the highest on record. December also recorded the strongest monthly mean speed for any month at 7.8 mph. June gets a mention for having only 9mm of rain, the second driest on record after April 2011's 2mm. April was the sunniest month of the year. And July 1st recorded the highest temp on the record, 34C.
For the website, nw3weather again saw its busiest year since launching in Sep 2010, with 84,000 visits (up from 75,000 in 2014), giving a mean figure of 231 per-day. The median was 210, since busy days (commonly very wet, windy, hot or cold days) skew the figure. The most in a single day was 679 on 1st July, the hottest day in nw3weather history. The fewest was 116 on 17th Oct, a quiet Saturday (which is generally the quietest day of the week). 2015 also saw the introduction of the nw3weather twitter feed, a way for me to share crazy (and mundane) statistics from the data I record.
Summary of Data
- Temperature
- Mean 11.8 C (+1.1 C from the LTA). Absolute Min and Max: -4.1 C (23rd Jan), and 34.2 C (1st Jul).
- Rainfall
- Total: 594 mm (-5%) across 172 days (47%) of recordable rain.
Highest daily (starting at midnight) total: 32 mm (24th Jul).
Wettest Month: 78 mm [+47%] (Aug). Most rainy: 24 days (Dec).
Driest: 9.4 mm [-83%] (Jun) across 6 days of rainfall. - Sunshine
- Total: 1440 hrs (-2%) from a possible 4038. (36%)
Days with more than a minute of sunshine: 308 days (84%).
Dullest Month: 36 hrs [-47%] (Nov) across 20 days of countable sunshine.
Sunniest: 202 hrs [+47%] (Apr). - Winter Events
- There was one day with lying snow (2cm on 3rd Feb), and 5 with falling snow, as well as 13 air frosts (-13), 7 in Jan, 5 in Feb, and 1 in Nov.
- Other Events
- There were 0 days of hail, 6 with thunder, and 3 with fog at 09z.
These pages are useful for comparing all aspects of the weather across the years .
Updated: 4th Jan 2016Year 2014
2014 was the sixth year of records for this weather station, and the fourth complete year in its current location in nw3.
It was the wettest of these, with a 31% excess compared to the expected long-term climatic average.
Five of the top-ten wettest days across all six years fell in 2014's Aug-Nov period alone, which also contains the
overall wettest day, the 13th Oct 2014, with 41 mm.
For the first time, more than half of days had some measurable rainfall, whilst January had just one complete dry day all month.
Despite this, 2014 was both the warmest and sunniest in my records. The mean temperature was 1.3 C above average (Across England the anomaly was similar, and moreover 2014 was the warmest year in 357 years of records). August was the only month to come in below average, while Jan-Apr all came at least two degrees above. For the first time, there was absolutely no snowfall, and the year had the fewest air frosts on record.
For the website, nw3weather saw its busiest year since launching in Sep 2010, with 75,000 visits (up from 63,000 in 2013),
giving a mean figure of 206 per-day. The median was 188, since busy days (commonly very wet or windy days) skew the figure.
The most in a single day was 600 on 14th Feb,
a wet and extremely windy day (50 mph gusts). The fewest was 106 on 6th Sep, a quiet and overcast Saturday.
Looking ahead to 2015, this should see the completion of back-end website upgrades, with only minor UI and informational changes.
Summary of Data
- Temperature
- Mean 12.3 C (+1.3 C from the LTA). Absolute Min and Max: -1.4 C (30th Dec), and 31.2 C (18th Jul).
- Rainfall
- Total: 815.2 mm (+31%) across 185 days (51%) of recordable rain.
Highest daily (starting at midnight) total: 40.7 mm (13th Oct).
Wettest Month: 141.5 mm across 30 days (Jan). Driest: 22.9 mm (Mar); Least Rainy: 5 days (Sep). - Sunshine
- Total: 1599 hrs (+9%) from a possible 4038.
Days with more than a minute of sunshine: 322 days (88%). - Winter Events
- There were no days of falling snow or sleet (20 below the LTA), and 7 air frosts (-19).
- Other Events
- There were 2 days of hail, 14 with thunder, and 1 with fog at 09z.
These pages are useful for comparing all aspects of the weather across the years .
Updated: 10th Jan 2015This page is for archived annual reports which first appear on the home page. Expansion plans are afoot but may take a while.