| Measure | Value (anomaly) | Time |
Month cumul. | Record High | Record Low |
| Minimum Temperature |
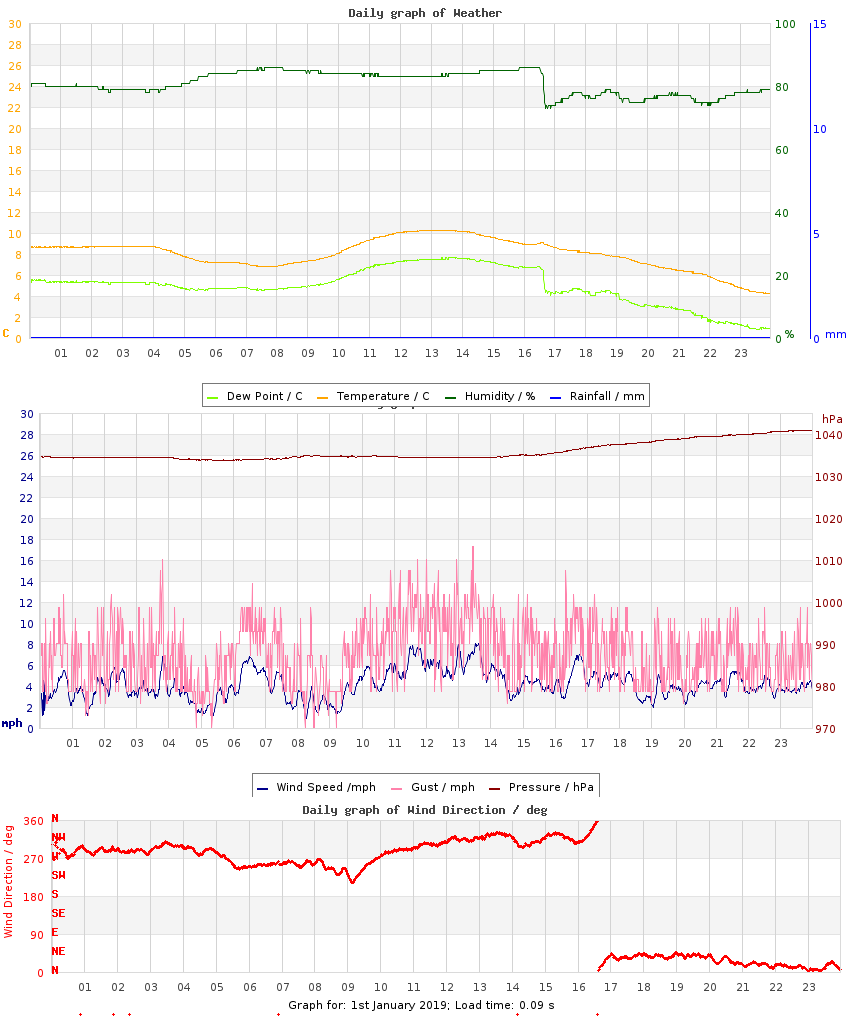
4.2 °C (+1.0) |
23:52 |
4.2 °C (+1.0) |
12.9 °C (+9.7), 2022 |
-1.7 °C (-4.9), 2010 |
| Maximum Temperature |
10.3 °C (+2.5) |
13:12 |
10.3 °C (+2.5) |
15.3 °C (+7.5), 2022 |
2.4 °C (-5.4), 2010 |
| Mean Temperature |
8.0 °C (+1.7) |
|
8.0 °C (+1.7) |
13.5 °C, 2022 |
-0.0 °C, 2010 |
| Minimum Humidity |
73% |
16:42 |
73% |
90%, 2021 |
60%, 2009 |
| Maximum Humidity |
86% |
16:11 |
86% |
97%, 2014 |
83%, 2009 |
| Mean Humidity |
81% |
|
81% |
93%, 2021 |
72%, 2009 |
| Minimum Pressure |
1034 hPa |
05:30 |
1034 hPa |
1034 hPa, 2019 |
984 hPa, 2014 |
| Maximum Pressure |
1041 hPa |
23:50 |
1041 hPa |
1041 hPa, 2019 |
1002 hPa, 2014 |
| Mean Pressure |
1036 hPa |
|
1036 hPa |
1036 hPa, 2019 |
992 hPa, 2014 |
| Mean Wind Speed |
4.1 mph (-1.1) |
|
4.1 mph (-1.1) |
11.1 mph, 2025 |
1.9 mph, 2021 |
| Maximum Wind Speed |
11.8 mph |
12:55 |
11.8 mph |
26.8 mph, 2025 |
5.8 mph, 2021 |
| Maximum Gust |
17.3 mph |
13:26 |
17.3 mph |
44.9 mph, 2025 |
10.0 mph, 2009 |
| Mean Wind Direction |
NW |
|
|
|
|
| Rainfall |
0.0 mm |
|
0.0 mm (0%) |
12.5 mm, 2025 |
|
| Maximum Hourly Rain |
n/a |
|
|
4.6, 2025 |
|
| Maximum 10-min Rain |
n/a |
|
|
1.9, 2025 |
|
| Maximum Rain Rate |
n/a |
|
|
54, 2025 |
|
| Minimum Dew Point |
0.8 °C |
23:34 |
0.8 °C |
10.0 °C, 2022 |
-3.4 °C, 2010 |
| Maximum Dew Point |
7.7 °C |
13:41 |
7.7 °C |
12.0 °C, 2022 |
-0.9 °C, 2010 |
| Mean Dew Point |
4.9 °C |
|
4.9 °C |
11.2 °C, 2022 |
-2.4 °C, 2010 |
| Measure | Value | Time |
Month cumul. | Record High | Record Low |
| Night Minimum (21-09) |
* 6.8 °C * |
07:41 |
6.8 °C |
12.8 °C, 2022 |
-1.2 °C, 2010 |
| Day Maximum (09-21) |
10.3 °C |
13:11 |
10.3 °C |
15.3 °C, 2022 |
2.4 °C, 2010 |
| Max 10m Temp Rise |
0.3 °C |
10:12 |
0.3 °C |
0.4 °C, 2016 |
0.2 °C, 2011 |
| Max 1hr Temp Rise |
1.3 °C |
10:53 |
1.3 °C |
1.7 °C, 2016 |
0.5 °C, 2025 |
| Max 1hr Hum Rise |
5% |
17:42 |
5% |
8%, 2014 |
3%, 2011 |
| Max 10m Temp Fall |
0.3 °C |
22:12 |
0.3 °C |
1.6 °C, 2017 |
0.1 °C, 2015 |
| Max 1hr Temp Fall |
1.3 °C |
22:55 |
1.3 °C |
4.5 °C, 2025 |
0.0 °C, 2015 |
| Max 1hr Hum Fall |
13% |
16:52 |
13% |
13%, 2019 |
2%, 2015 |
| Max 10m Wind Speed |
8.1 mph |
13:31 |
8.1 mph |
20.7 mph, 2025 |
4.5 mph, 2020 |
| Minimum Feels-like |
0.2 °C |
23:49 |
0.2 °C |
14.3 °C, 2022 |
-6.3 °C, 2010 |
| Maximum Feels-like |
10.6 °C |
13:20 |
10.6 °C |
17.1 °C, 2022 |
2.4 °C, 2010 |
| Mean Feels-like |
6.5 °C |
|
6.5 °C |
15.4 °C, 2022 |
-2.7 °C, 2010 |
| Air-frost Hrs |
0 hrs |
|
0 hrs |
12 hrs, 2010 |
0 hrs, 2011 |
| Measure | Value (anomaly) |
Month cumul. | Record High | Record Low |
| Temperature Range |
6.1 °C (+1.5) |
6.1 °C (+1.5) |
7.5 °C (+2.9), 2016 |
2.3 °C (-2.3), 2018 |
| Humidity Range |
13% |
13% |
27%, 2013 |
5%, 2021 |
| Pressure Range |
7 hPa |
7 hPa |
19 hPa, 2013 |
1 hPa, 2009 |
| Measure | Value [% of max] |
Month cumul. | Record High | Record Low |
| Sun Hours |
1 [14%] | 1 hrs (48%) [14%] |
7 [99%], 2010 |
0 [0%], 2009 |
| Wet Hours |
0 | 0 hrs (0%) [0%] |
9, 2017 |
, 2009 |
| Cloud Cover |
Mostly Cloudy with periods of Partly Cloudy |
| Events |
None |
| Comments |
- |
| Extra Comments |
some fireworks visible on skycam |
| Issues |
None known |
| Observer Absent? |
Yes - observations may be unreliable |
| Pond Temperature @ Hampstead Heath |
n/a |


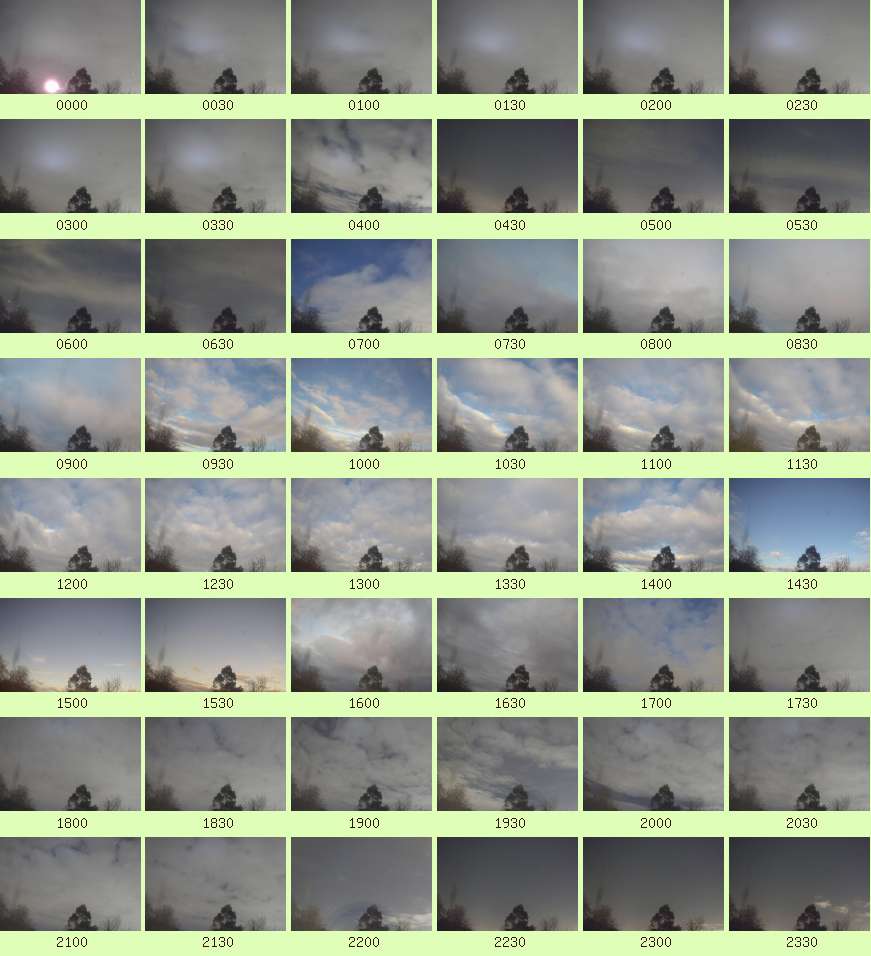 Full resolution individual images at up-to 5 minute intervals