| Measure | Value (anomaly) | Time |
Month cumul. | Record High | Record Low |
| Minimum Temperature |
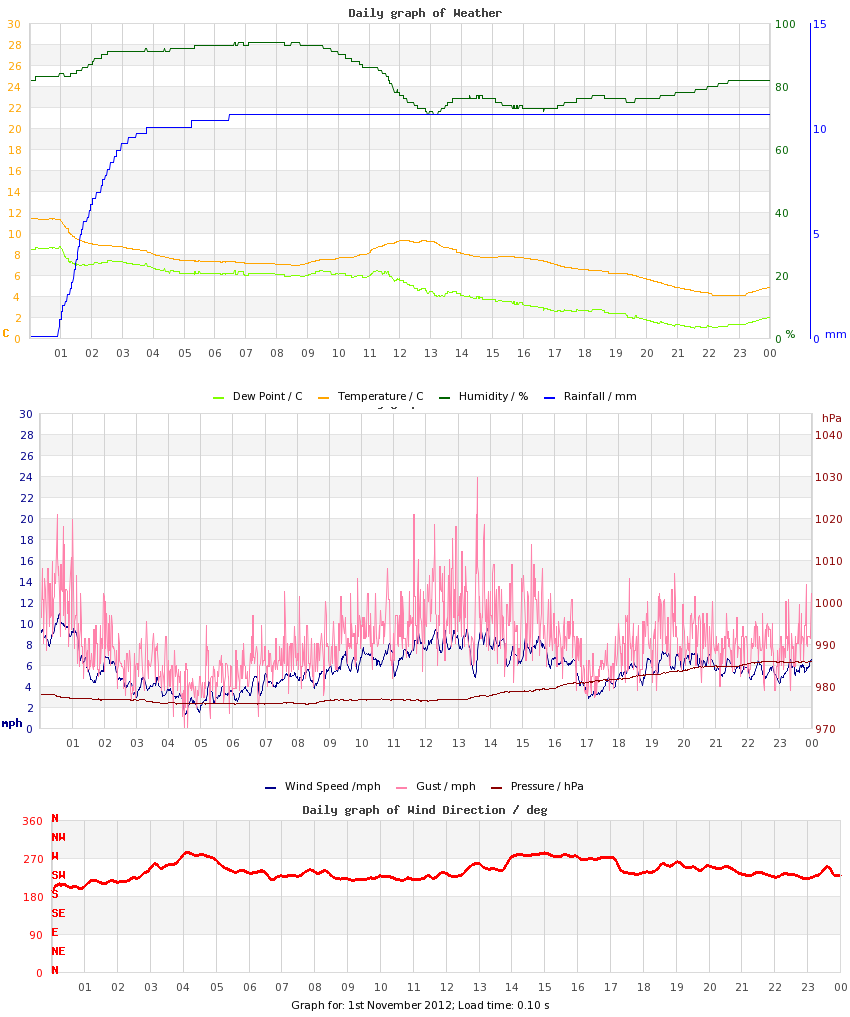
4.1 °C (-2.8) |
22:38 |
4.1 °C (-2.7) |
13.1 °C (+6.2), 2014 |
4.1 °C (-2.8), 2012 |
| Maximum Temperature |
11.4 °C (-1.0) |
00:24 |
11.4 °C (-0.9) |
16.9 °C (+4.5), 2014 |
11.4 °C (-1.0), 2012 |
| Mean Temperature |
7.4 °C (-1.9) |
|
7.4 °C (-1.8) |
15.3 °C, 2014 |
7.4 °C, 2012 |
| Minimum Humidity |
71% |
13:01 |
71% |
90%, 2015 |
51%, 2014 |
| Maximum Humidity |
94% |
07:39 |
94% |
98%, 2009 |
81%, 2016 |
| Mean Humidity |
83% |
|
83% |
94%, 2015 |
76%, 2014 |
| Minimum Pressure |
975 hPa |
04:11 |
975 hPa |
1027 hPa, 2015 |
975 hPa, 2012 |
| Maximum Pressure |
986 hPa |
22:52 |
986 hPa |
1031 hPa, 2015 |
986 hPa, 2012 |
| Mean Pressure |
979 hPa |
|
979 hPa |
1029 hPa, 2015 |
979 hPa, 2012 |
| Mean Wind Speed |
5.8 mph (+1.2) |
|
5.8 mph (+1.2) |
10.8 mph, 2022 |
0.5 mph, 2015 |
| Maximum Wind Speed |
14.5 mph |
13:34 |
14.5 mph |
26.8 mph, 2022 |
4.0 mph, 2015 |
| Maximum Gust |
23.9 mph |
13:35 |
23.9 mph |
43.8 mph, 2022 |
5.4 mph, 2015 |
| Mean Wind Direction |
WSW |
|
|
|
|
| Rainfall |
10.6 mm |
|
10.6 mm (475%) |
13.7 mm, 2009 |
|
| Maximum Hourly Rain |
5.7 mm |
01:51 |
|
5.7 mm, 2012 |
|
| Maximum 10-min Rain |
1.7 mm |
01:38 |
|
3.3 mm, 2018 |
|
| Maximum Rain Rate |
24 mm/h |
01:26 |
|
53 mm/h, 2018 |
|
| Minimum Dew Point |
0.9 °C |
21:31 |
0.9 °C |
10.1 °C, 2013 |
0.9 °C, 2012 |
| Maximum Dew Point |
8.7 °C |
00:57 |
8.7 °C |
15.8 °C, 2009 |
8.3 °C, 2021 |
| Mean Dew Point |
4.6 °C |
|
4.6 °C |
12.2 °C, 2020 |
4.6 °C, 2012 |
| Measure | Value | Time |
Month cumul. | Record High | Record Low |
| Night Minimum (21-09) |
* 6.9 °C * |
08:34 |
6.9 °C |
15.8 °C, 2014 |
6.2 °C, 2015 |
| Day Maximum (09-21) |
* 9.3 °C * |
12:23 |
9.3 °C |
16.9 °C, 2014 |
9.3 °C, 2012 |
| Max 10m Temp Rise |
0.4 °C |
11:03 |
0.4 °C |
0.5 °C, 2009 |
0.2 °C, 2018 |
| Max 1hr Temp Rise |
1.2 °C |
11:57 |
1.2 °C |
1.8 °C, 2020 |
0.4 °C, 2024 |
| Max 1hr Hum Rise |
6% |
02:06 |
6% |
14%, 2025 |
1%, 2016 |
| Max 10m Temp Fall |
0.7 °C |
01:07 |
0.7 °C |
1.2 °C, 2022 |
0.2 °C, 2010 |
| Max 1hr Temp Fall |
2.3 °C |
01:46 |
2.3 °C |
3.1 °C, 2022 |
0.4 °C, 2019 |
| Max 1hr Hum Fall |
11% |
12:12 |
11% |
22%, 2009 |
2%, 2015 |
| Max 10m Wind Speed |
10.9 mph |
00:36 |
10.9 mph |
20.7 mph, 2022 |
3.7 mph, 2015 |
| Minimum Feels-like |
0.0 °C |
23:10 |
0.0 °C |
13.8 °C, 2014 |
0.0 °C, 2012 |
| Maximum Feels-like |
12.1 °C |
00:10 |
12.1 °C |
20.8 °C, 2020 |
12.1 °C, 2012 |
| Mean Feels-like |
5.2 °C |
|
5.2 °C |
17.1 °C, 2014 |
5.2 °C, 2012 |
| Air-frost Hrs |
0 hrs |
|
0 hrs |
0 hrs, 2009 |
0 hrs, 2009 |
| Measure | Value (anomaly) |
Month cumul. | Record High | Record Low |
| Temperature Range |
7.3 °C (+1.8) |
7.3 °C (+1.8) |
7.3 °C (+1.8), 2012 |
1.6 °C (-3.9), 2024 |
| Humidity Range |
23% |
23% |
42%, 2017 |
6%, 2015 |
| Pressure Range |
11 hPa |
11 hPa |
27 hPa, 2019 |
3 hPa, 2016 |
| Measure | Value [% of max] |
Month cumul. | Record High | Record Low |
| Sun Hours |
3 [35%] | 3 hrs (99%) [35%] |
8 [93%], 2021 |
0 [0%], 2016 |
| Wet Hours |
5
[Mean rain rate: 2.1 mm/h] | 5 hrs (238%) [21%] |
10, 2018 |
0, 2010 |
| Cloud Cover |
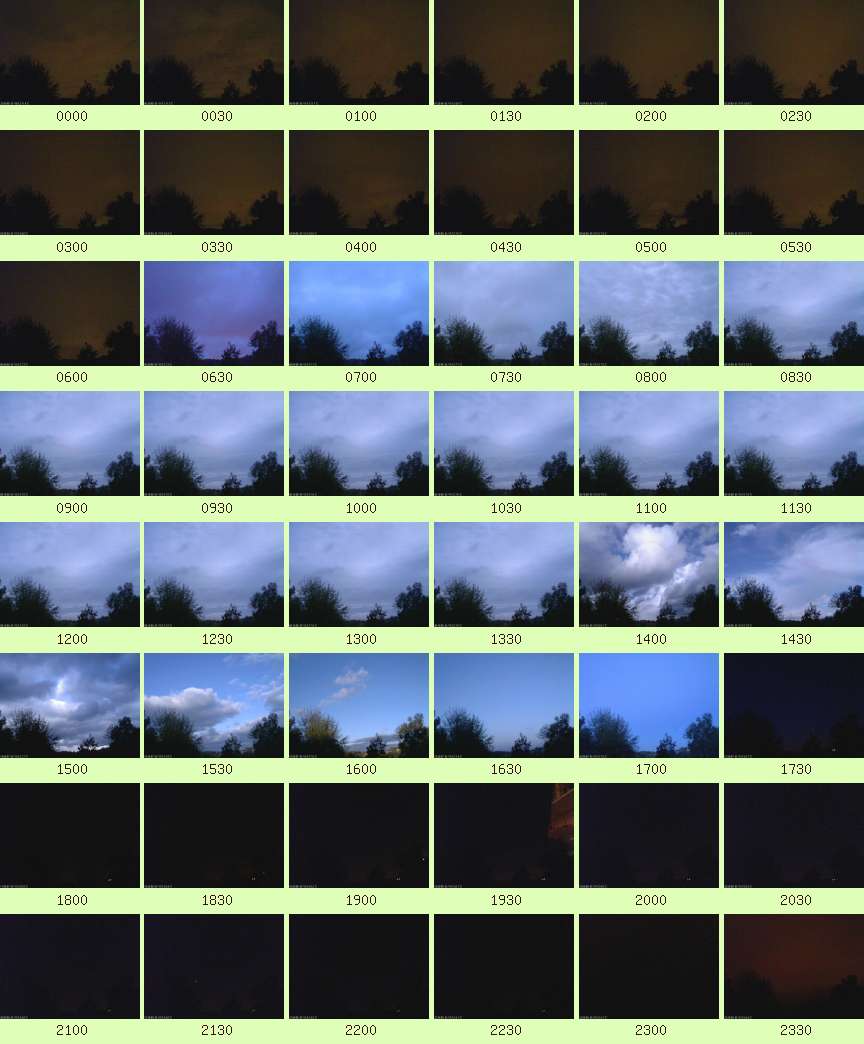
Mostly Cloudy with periods of Partly Cloudy |
| Events |
None |
| Comments |
01-04 Moderate/Heavy Rain, -07, 13 Showers |
| Extra Comments |
|
| Issues |
Webcam loss: 08-1330 |
| Observer Absent? |
No |
| Pond Temperature @ Hampstead Heath |
0.0 °C |