| Measure | Value (anomaly) | Time |
Month cumul. | Record High | Record Low |
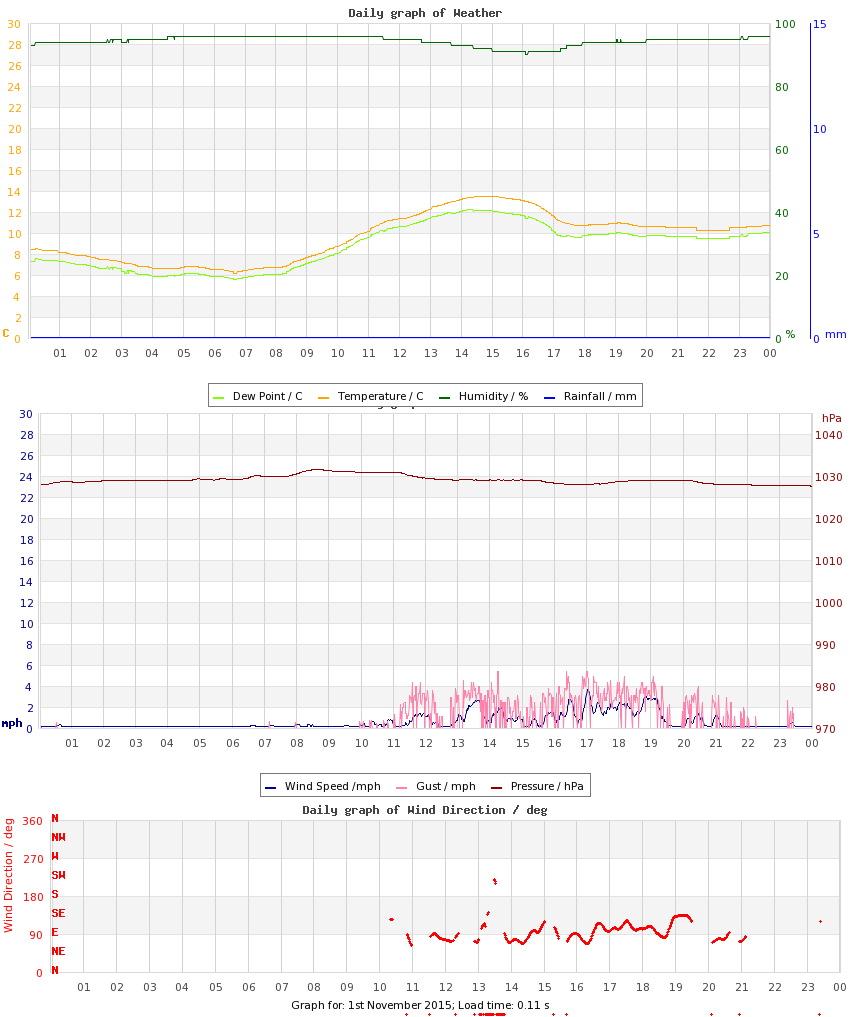
| Minimum Temperature |
6.2 °C (-0.8) |
06:41 |
6.2 °C (-0.7) |
13.1 °C (+6.1), 2014 |
4.1 °C (-2.9), 2012 |
| Maximum Temperature |
13.5 °C (+0.9) |
14:47 |
13.5 °C (+1.1) |
16.9 °C (+4.3), 2014 |
11.4 °C (-1.2), 2012 |
| Mean Temperature |
9.6 °C (+0.0) |
|
9.6 °C (+0.2) |
15.3 °C, 2014 |
7.4 °C, 2012 |
| Minimum Humidity |
90% |
16:05 |
90% |
90%, 2015 |
51%, 2014 |
| Maximum Humidity |
96% |
08:30 |
96% |
98%, 2009 |
81%, 2016 |
| Mean Humidity |
94% |
|
94% |
94%, 2015 |
76%, 2014 |
| Minimum Pressure |
1027 hPa |
23:25 |
1027 hPa |
1027 hPa, 2015 |
975 hPa, 2012 |
| Maximum Pressure |
1031 hPa |
08:20 |
1031 hPa |
1031 hPa, 2015 |
986 hPa, 2012 |
| Mean Pressure |
1029 hPa |
|
1029 hPa |
1029 hPa, 2015 |
979 hPa, 2012 |
| Mean Wind Speed |
0.5 mph (-4.1) |
|
0.5 mph (-4.1) |
10.8 mph, 2022 |
0.5 mph, 2015 |
| Maximum Wind Speed |
4.0 mph |
16:22 |
4.0 mph |
26.8 mph, 2022 |
4.0 mph, 2015 |
| Maximum Gust |
5.4 mph |
14:13 |
5.4 mph |
43.8 mph, 2022 |
5.4 mph, 2015 |
| Mean Wind Direction |
ESE |
|
|
|
|
| Rainfall |
0.0 mm |
|
0.0 mm (0%) |
13.7 mm, 2009 |
|
| Maximum Hourly Rain |
n/a |
|
|
5.7, 2012 |
|
| Maximum 10-min Rain |
n/a |
|
|
3.3, 2018 |
|
| Maximum Rain Rate |
n/a |
|
|
53, 2018 |
|
| Minimum Dew Point |
5.6 °C |
06:41 |
5.6 °C |
10.1 °C, 2013 |
0.9 °C, 2012 |
| Maximum Dew Point |
12.3 °C |
14:15 |
12.3 °C |
15.8 °C, 2009 |
8.3 °C, 2021 |
| Mean Dew Point |
8.8 °C |
|
8.8 °C |
12.2 °C, 2020 |
4.6 °C, 2012 |
| Measure | Value | Time |
Month cumul. | Record High | Record Low |
| Night Minimum (21-09) |
6.2 °C |
06:41 |
6.2 °C |
15.8 °C, 2014 |
6.2 °C, 2015 |
| Day Maximum (09-21) |
13.5 °C |
14:47 |
13.5 °C |
16.9 °C, 2014 |
9.3 °C, 2012 |
| Max 10m Temp Rise |
0.4 °C |
10:25 |
0.4 °C |
0.5 °C, 2009 |
0.2 °C, 2018 |
| Max 1hr Temp Rise |
1.7 °C |
11:05 |
1.7 °C |
1.8 °C, 2020 |
0.4 °C, 2024 |
| Max 1hr Hum Rise |
3% |
17:53 |
3% |
13%, 2021 |
1%, 2016 |
| Max 10m Temp Fall |
0.5 °C |
17:02 |
0.5 °C |
1.2 °C, 2022 |
0.2 °C, 2010 |
| Max 1hr Temp Fall |
1.9 °C |
17:14 |
1.9 °C |
3.1 °C, 2022 |
0.4 °C, 2019 |
| Max 1hr Hum Fall |
2% |
13:39 |
2% |
22%, 2009 |
2%, 2015 |
| Max 10m Wind Speed |
3.7 mph |
17:00 |
3.7 mph |
20.7 mph, 2022 |
3.7 mph, 2015 |
| Minimum Feels-like |
6.2 °C |
06:38 |
6.2 °C |
13.8 °C, 2014 |
0.0 °C, 2012 |
| Maximum Feels-like |
15.9 °C |
14:23 |
15.9 °C |
20.8 °C, 2020 |
12.1 °C, 2012 |
| Mean Feels-like |
10.5 °C |
|
10.5 °C |
17.1 °C, 2014 |
5.2 °C, 2012 |
| Air-frost Hrs |
0 hrs |
|
0 hrs |
0 hrs, 2009 |
0 hrs, 2009 |
| Measure | Value (anomaly) |
Month cumul. | Record High | Record Low |
| Temperature Range |
7.3 °C (+1.7) |
7.3 °C (+1.8) |
7.3 °C (+1.7), 2012 |
1.6 °C (-4.0), 2024 |
| Humidity Range |
6% |
6% |
42%, 2017 |
6%, 2015 |
| Pressure Range |
4 hPa |
4 hPa |
27 hPa, 2019 |
3 hPa, 2016 |
| Measure | Value [% of max] |
Month cumul. | Record High | Record Low |
| Sun Hours |
5.5 [64%] | 5.5 hrs (181%) [64%] |
8 [92%], 2021 |
0 [0%], 2016 |
| Wet Hours |
0 | 0 hrs (0%) [0%] |
10, 2018 |
0, 2010 |
| Cloud Cover |
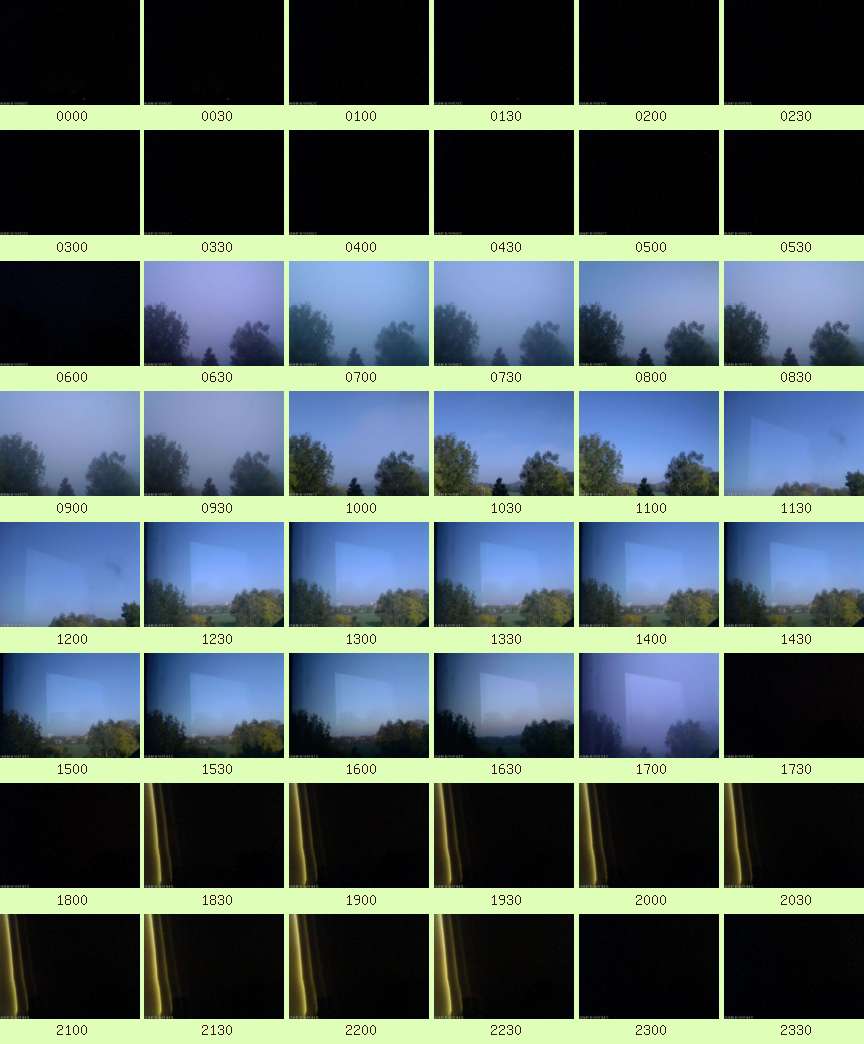
am: Overcast transitioned to Sunny
pm: Sunny |
| Events |
Dense Fog |
| Comments |
Dense fog cleared at 10z, returned at 17z |
| Extra Comments |
Wx server & cams MOVED upstairs at 11z; foggy tip removed |
| Issues |
Glare on webcams due to move. Needs resolving |
| Observer Absent? |
No |
| Pond Temperature (Heath) |
0.0 °C |


 Large resolution version
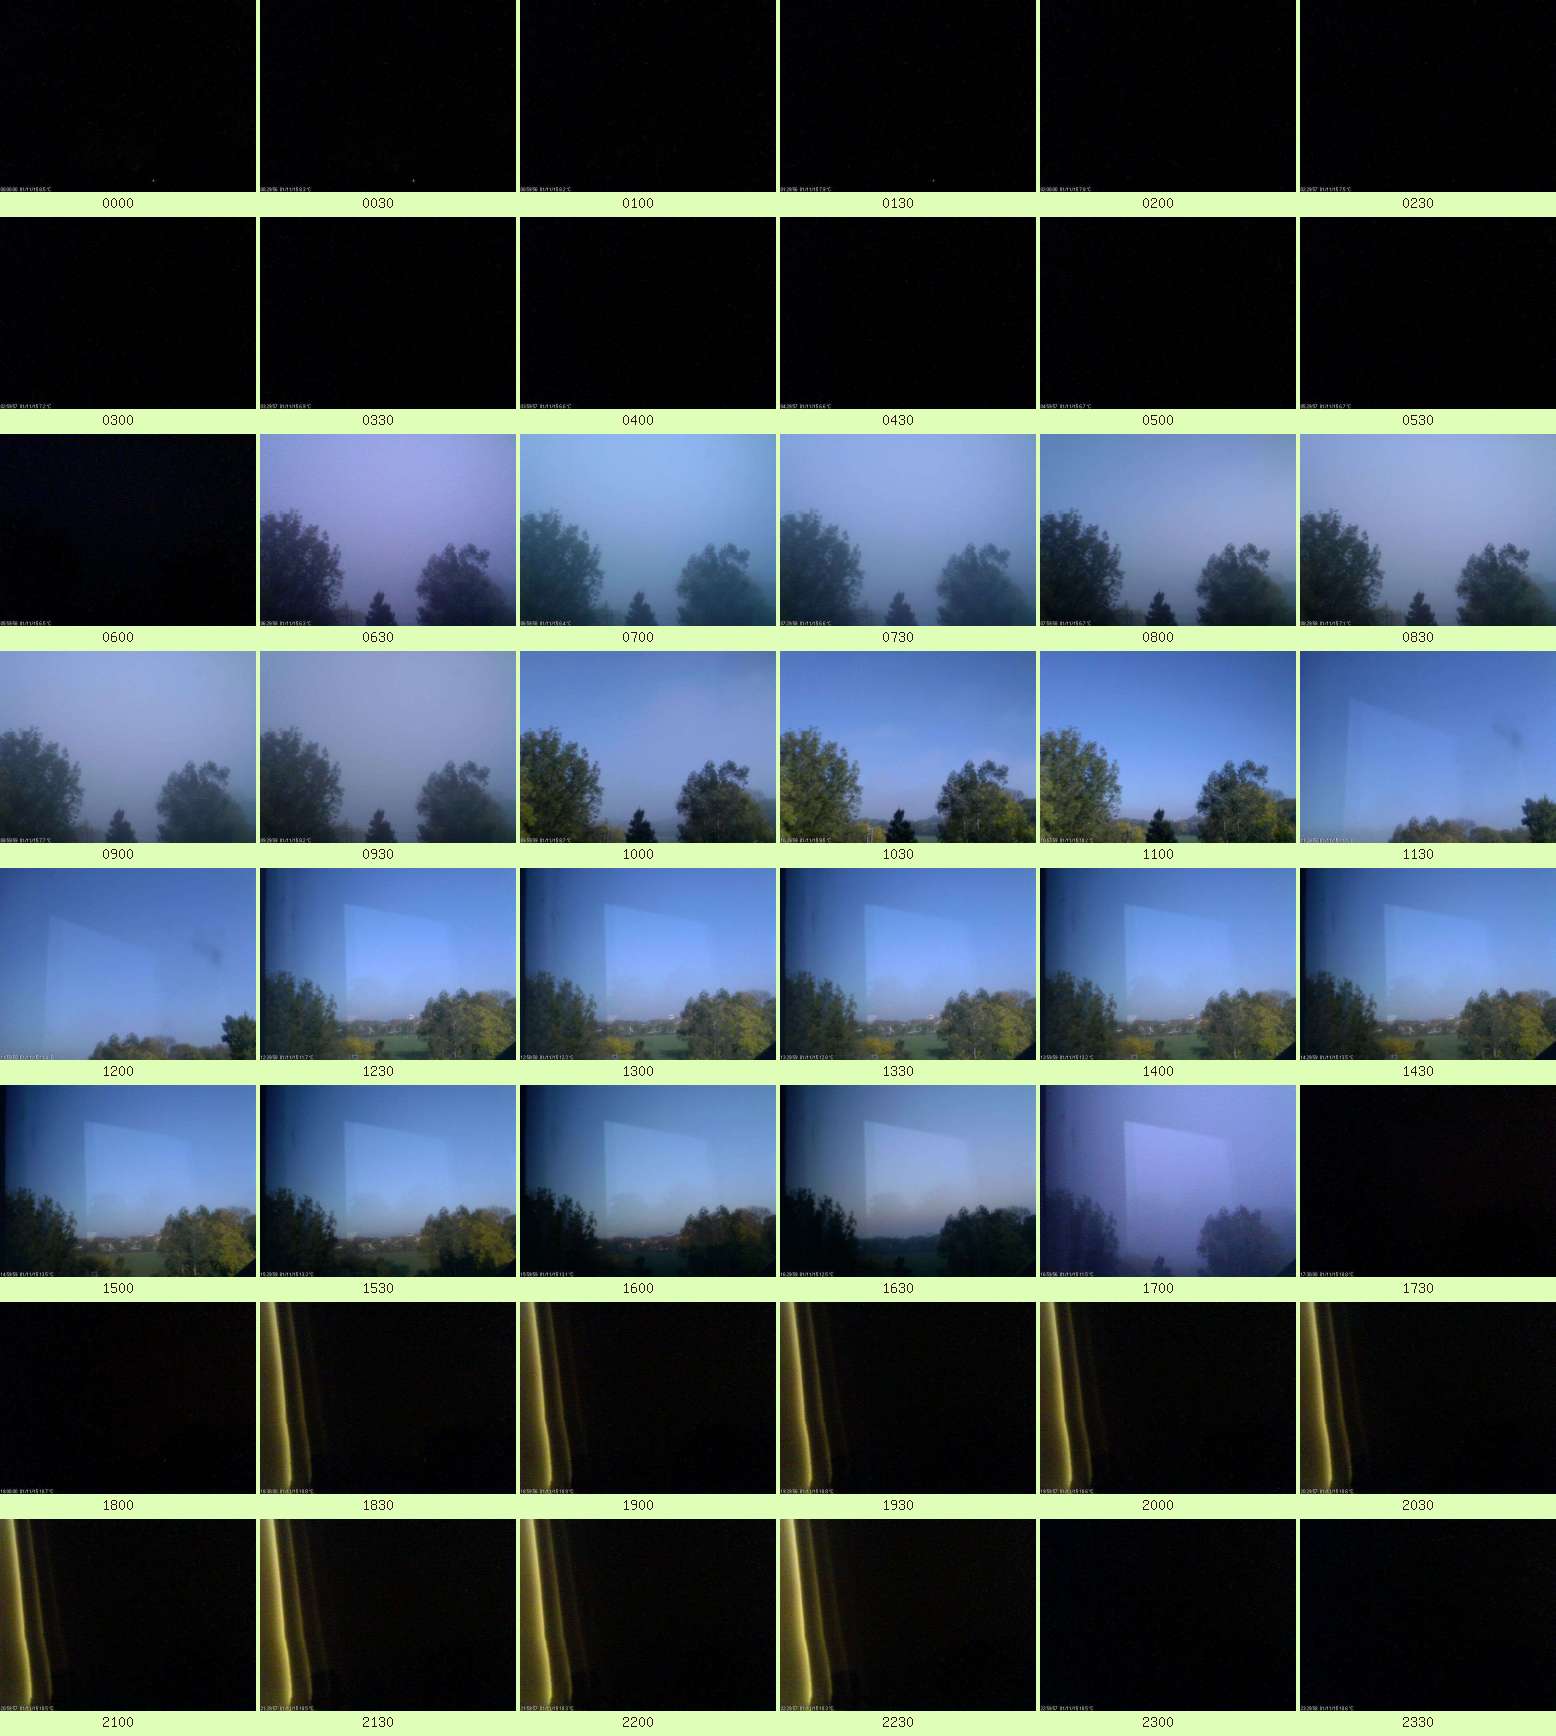