| Measure | Value (anomaly) | Time |
Month cumul. | Record High | Record Low |
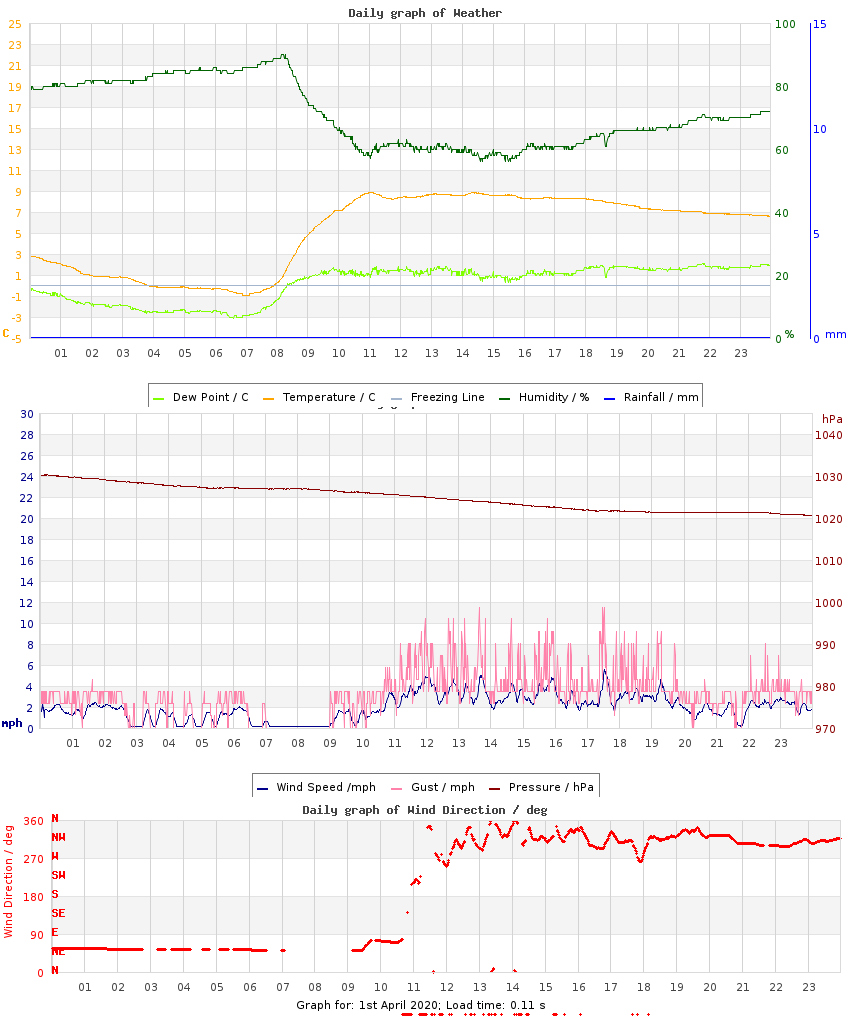
| Minimum Temperature |
-0.9 °C (-6.3) |
06:59 |
-0.9 °C (-6.3) |
11.8 °C (+6.4), 2011 |
-0.9 °C (-6.3), 2020 |
| Maximum Temperature |
8.9 °C (-4.1) |
11:02 |
8.9 °C (-4.2) |
18.5 °C (+5.5), 2014 |
5.3 °C (-7.7), 2013 |
| Mean Temperature |
5.1 °C (-5.2) |
|
5.1 °C (-5.3) |
13.5 °C, 2014 |
2.4 °C, 2013 |
| Minimum Humidity |
56% |
14:35 |
56% |
80%, 2023 |
36%, 2012 |
| Maximum Humidity |
90% |
08:10 |
90% |
95%, 2014 |
75%, 2013 |
| Mean Humidity |
71% |
|
71% |
88%, 2023 |
56%, 2015 |
| Minimum Pressure |
1021 hPa |
23:53 |
1021 hPa |
1024 hPa, 2025 |
991 hPa, 2024 |
| Maximum Pressure |
1030 hPa |
00:00 |
1030 hPa |
1030 hPa, 2020 |
999 hPa, 2024 |
| Mean Pressure |
1025 hPa |
|
1025 hPa |
1027 hPa, 2025 |
995 hPa, 2024 |
| Mean Wind Speed |
2.0 mph (-2.9) |
|
2.0 mph (-2.9) |
9.2 mph, 2015 |
1.0 mph, 2014 |
| Maximum Wind Speed |
8.3 mph |
11:57 |
8.3 mph |
19.7 mph, 2013 |
7.1 mph, 2014 |
| Maximum Gust |
11.5 mph |
13:38 |
11.5 mph |
35.4 mph, 2022 |
9.0 mph, 2012 |
| Mean Wind Direction |
NNW |
|
|
|
|
| Rainfall |
0.0 mm |
|
0.0 mm (0%) |
3.6 mm, 2024 |
|
| Maximum Hourly Rain |
n/a |
|
|
2.2, 2018 |
|
| Maximum 10-min Rain |
n/a |
|
|
1.4, 2014 |
|
| Maximum Rain Rate |
n/a |
|
|
30, 2024 |
|
| Minimum Dew Point |
-3.1 °C |
06:35 |
-3.1 °C |
9.4 °C, 2011 |
-7.2 °C, 2013 |
| Maximum Dew Point |
2.1 °C |
21:47 |
2.1 °C |
12.0 °C, 2014 |
-2.2 °C, 2013 |
| Mean Dew Point |
0.2 °C |
|
0.2 °C |
10.0 °C, 2011 |
-4.6 °C, 2013 |
| Measure | Value | Time |
Month cumul. | Record High | Record Low |
| Night Minimum (21-09) |
-0.9 °C |
06:59 |
-0.9 °C |
11.8 °C, 2011 |
-0.9 °C, 2020 |
| Day Maximum (09-21) |
8.9 °C |
12:45 |
8.9 °C |
18.5 °C, 2014 |
5.3 °C, 2013 |
| Max 10m Temp Rise |
1.0 °C |
08:25 |
1.0 °C |
1.2 °C, 2022 |
0.3 °C, 2011 |
| Max 1hr Temp Rise |
4.7 °C |
09:04 |
4.7 °C |
4.8 °C, 2016 |
1.0 °C, 2018 |
| Max 1hr Hum Rise |
6% |
19:40 |
6% |
23%, 2010 |
5%, 2011 |
| Max 10m Temp Fall |
0.3 °C |
00:27 |
0.3 °C |
2.7 °C, 2022 |
0.3 °C, 2014 |
| Max 1hr Temp Fall |
1.1 °C |
01:44 |
1.1 °C |
3.4 °C, 2021 |
0.9 °C, 2023 |
| Max 1hr Hum Fall |
18% |
09:16 |
18% |
19%, 2016 |
6%, 2023 |
| Max 10m Wind Speed |
5.5 mph |
17:31 |
5.5 mph |
14.8 mph, 2022 |
4.5 mph, 2014 |
| Minimum Feels-like |
-2.3 °C |
05:53 |
-2.3 °C |
12.9 °C, 2011 |
-7.2 °C, 2022 |
| Maximum Feels-like |
8.9 °C |
11:04 |
8.9 °C |
18.9 °C, 2014 |
2.1 °C, 2013 |
| Mean Feels-like |
4.4 °C |
|
4.4 °C |
14.8 °C, 2011 |
-2.0 °C, 2013 |
| Air-frost Hrs |
4 hrs |
|
4 hrs |
4 hrs, 2020 |
0 hrs, 2009 |
| Measure | Value (anomaly) |
Month cumul. | Record High | Record Low |
| Temperature Range |
9.8 °C (+2.2) |
9.8 °C (+2.1) |
13.9 °C (+6.3), 2009 |
2.9 °C (-4.7), 2023 |
| Humidity Range |
34% |
34% |
48%, 2012 |
13%, 2023 |
| Pressure Range |
10 hPa |
10 hPa |
20 hPa, 2023 |
2 hPa, 2013 |
| Measure | Value [% of max] |
Month cumul. | Record High | Record Low |
| Sun Hours |
3.5 [30%] | 3.5 hrs (70%) [30%] |
11.5 [99%], 2019 |
0 [0%], 2018 |
| Wet Hours |
0 | 0 hrs (0%) [0%] |
2, 2015 |
0, 2009 |
| Cloud Cover |
am: Sunny transitioned to Overcast
pm: Overcast |
| Events |
Air Frost |
| Comments |
- |
| Extra Comments |
|
| Issues |
no pond temp due to covid |
| Observer Absent? |
Yes - observations may be unreliable |
| Pond Temperature @ Hampstead Heath |
5.0 °C |


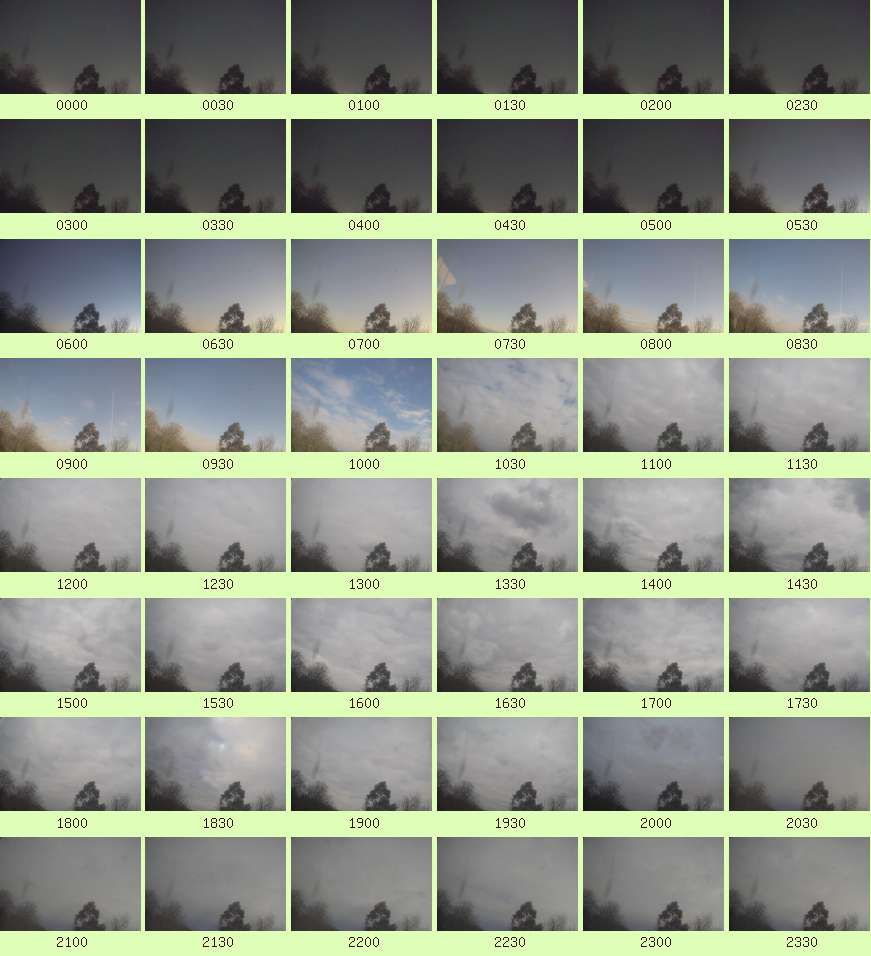 Full resolution individual images at up-to 5 minute intervals