| Measure | Value (anomaly) | Time |
Month cumul. | Record High | Record Low |
| Minimum Temperature |
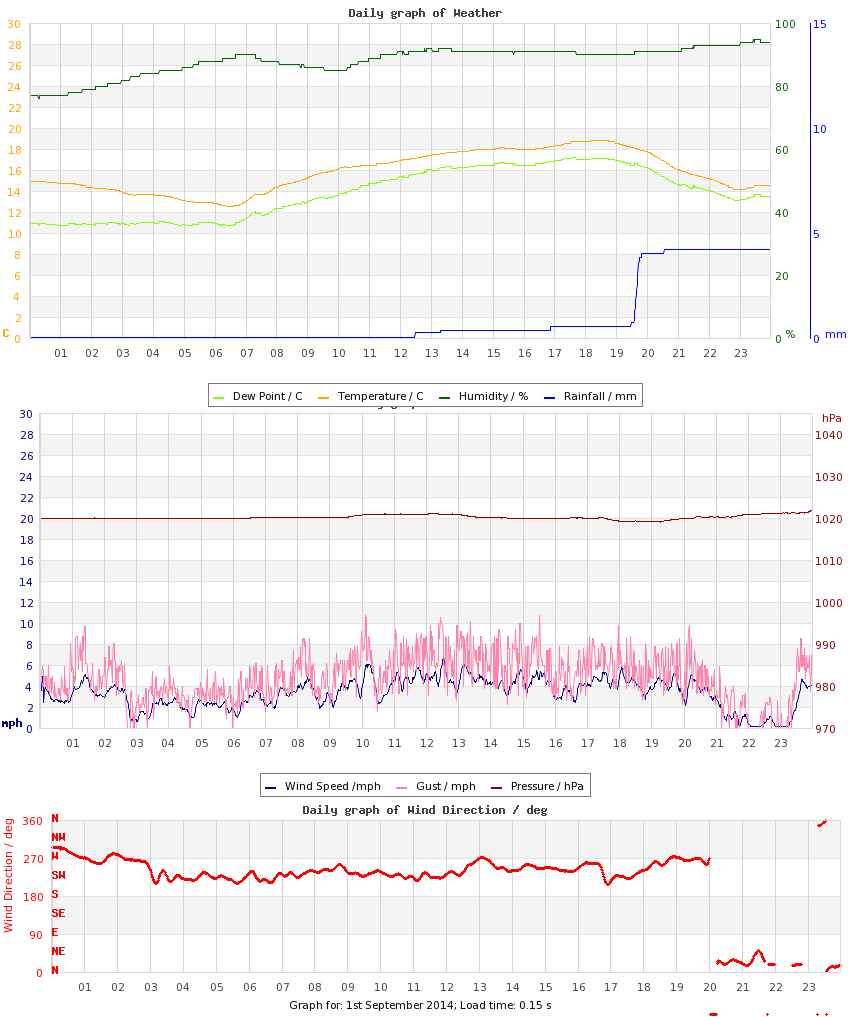
12.5 °C (-0.4) |
06:28 |
12.5 °C (-0.3) |
16.4 °C (+3.5), 2024 |
6.3 °C (-6.6), 2020 |
| Maximum Temperature |
18.8 °C (-2.5) |
18:27 |
18.8 °C (-2.4) |
27.4 °C (+6.1), 2024 |
17.8 °C (-3.5), 2015 |
| Mean Temperature |
15.8 °C (-1.4) |
|
15.8 °C (-1.4) |
21.1 °C, 2024 |
13.8 °C, 2020 |
| Minimum Humidity |
76% |
00:17 |
76% |
76%, 2014 |
40%, 2013 |
| Maximum Humidity |
95% |
23:32 |
95% |
96%, 2020 |
73%, 2013 |
| Mean Humidity |
88% |
|
88% |
89%, 2023 |
58%, 2013 |
| Minimum Pressure |
1019 hPa |
18:23 |
1019 hPa |
1030 hPa, 2021 |
1003 hPa, 2009 |
| Maximum Pressure |
1021 hPa |
22:39 |
1021 hPa |
1033 hPa, 2021 |
1007 hPa, 2025 |
| Mean Pressure |
1020 hPa |
|
1020 hPa |
1032 hPa, 2021 |
1005 hPa, 2025 |
| Mean Wind Speed |
3.3 mph (-0.6) |
|
3.3 mph (-0.6) |
6.3 mph, 2009 |
0.3 mph, 2020 |
| Maximum Wind Speed |
9.7 mph |
12:27 |
9.7 mph |
18.8 mph, 2025 |
5.2 mph, 2020 |
| Maximum Gust |
10.7 mph |
10:06 |
10.7 mph |
35.6 mph, 2009 |
8.1 mph, 2020 |
| Mean Wind Direction |
W |
|
|
|
|
| Rainfall |
4.2 mm |
|
4.2 mm (252%) |
5.8 mm, 2025 |
|
| Maximum Hourly Rain |
3.5 mm |
19:49 |
|
4.5 mm, 2015 |
|
| Maximum 10-min Rain |
2.8 mm |
19:42 |
|
3.1 mm, 2015 |
|
| Maximum Rain Rate |
30 mm/h |
19:41 |
|
48 mm/h, 2015 |
|
| Minimum Dew Point |
10.6 °C |
04:54 |
10.6 °C |
14.8 °C, 2024 |
3.4 °C, 2013 |
| Maximum Dew Point |
17.2 °C |
17:36 |
17.2 °C |
21.1 °C, 2024 |
9.8 °C, 2013 |
| Mean Dew Point |
13.8 °C |
|
13.8 °C |
17.9 °C, 2024 |
7.0 °C, 2013 |
| Measure | Value | Time |
Month cumul. | Record High | Record Low |
| Night Minimum (21-09) |
12.5 °C |
06:28 |
12.5 °C |
16.4 °C, 2024 |
6.3 °C, 2020 |
| Day Maximum (09-21) |
18.8 °C |
18:27 |
18.8 °C |
27.4 °C, 2024 |
17.8 °C, 2015 |
| Max 10m Temp Rise |
0.4 °C |
07:06 |
0.4 °C |
1.0 °C, 2010 |
0.4 °C, 2014 |
| Max 1hr Temp Rise |
1.5 °C |
07:53 |
1.5 °C |
4.5 °C, 2010 |
1.1 °C, 2015 |
| Max 1hr Hum Rise |
4% |
10:58 |
4% |
21%, 2025 |
4%, 2014 |
| Max 10m Temp Fall |
0.4 °C |
20:27 |
0.4 °C |
1.0 °C, 2025 |
0.2 °C, 2022 |
| Max 1hr Temp Fall |
1.7 °C |
21:07 |
1.7 °C |
4.0 °C, 2025 |
0.9 °C, 2021 |
| Max 1hr Hum Fall |
3% |
08:04 |
3% |
19%, 2020 |
3%, 2014 |
| Max 10m Wind Speed |
6.8 mph |
12:32 |
6.8 mph |
12.6 mph, 2025 |
2.9 mph, 2020 |
| Minimum Feels-like |
14.1 °C |
06:21 |
14.1 °C |
20.3 °C, 2024 |
6.3 °C, 2020 |
| Maximum Feels-like |
24.2 °C |
18:11 |
24.2 °C |
35.8 °C, 2024 |
20.5 °C, 2015 |
| Mean Feels-like |
19.2 °C |
|
19.2 °C |
27.1 °C, 2024 |
14.5 °C, 2020 |
| Air-frost Hrs |
0 hrs |
|
0 hrs |
0 hrs, 2009 |
0 hrs, 2009 |
| Minimum PM2.5 |
0 |
|
0 |
0, 2009 |
0, 2021 |
| Maximum PM2.5 |
n/a |
|
0 |
n/a |
n/a |
| Mean PM2.5 |
n/a |
|
0 |
n/a |
n/a |
| Measure | Value (anomaly) |
Month cumul. | Record High | Record Low |
| Temperature Range |
6.3 °C (-2.1) |
6.3 °C (-2.1) |
13.6 °C (+5.2), 2020 |
4.3 °C (-4.1), 2021 |
| Humidity Range |
19% |
19% |
51%, 2018 |
16%, 2021 |
| Pressure Range |
2 hPa |
2 hPa |
8 hPa, 2024 |
2 hPa, 2014 |
| Measure | Value [% of max] |
Month cumul. | Record High | Record Low |
| Sun Hours |
1 [8%] | 1 hrs (19%) [8.1%] |
12.2 [99%], 2010 |
0 [0%], 2021 |
| Wet Hours |
5
[Mean rain rate: 0.8 mm/h] | 5 hrs (366%) [21%] |
5, 2014 |
0, 2010 |
| Cloud Cover |
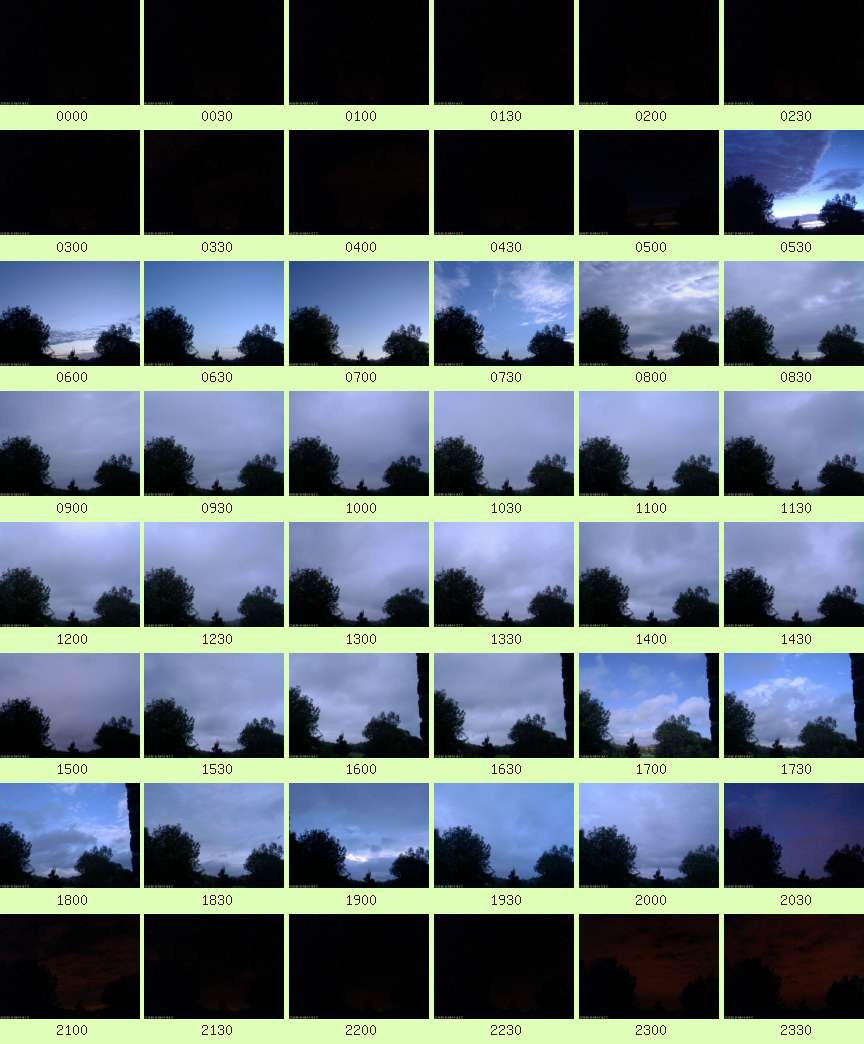
Overcast with periods of Mostly Cloudy |
| Events |
None |
| Comments |
10-17 Light Drizzle spells, 1930 Heavy Shower |
| Extra Comments |
|
| Issues |
None known |
| Observer Absent? |
No |
| Pond Temperature @ Hampstead Heath |
0.0 °C |


 Large resolution version
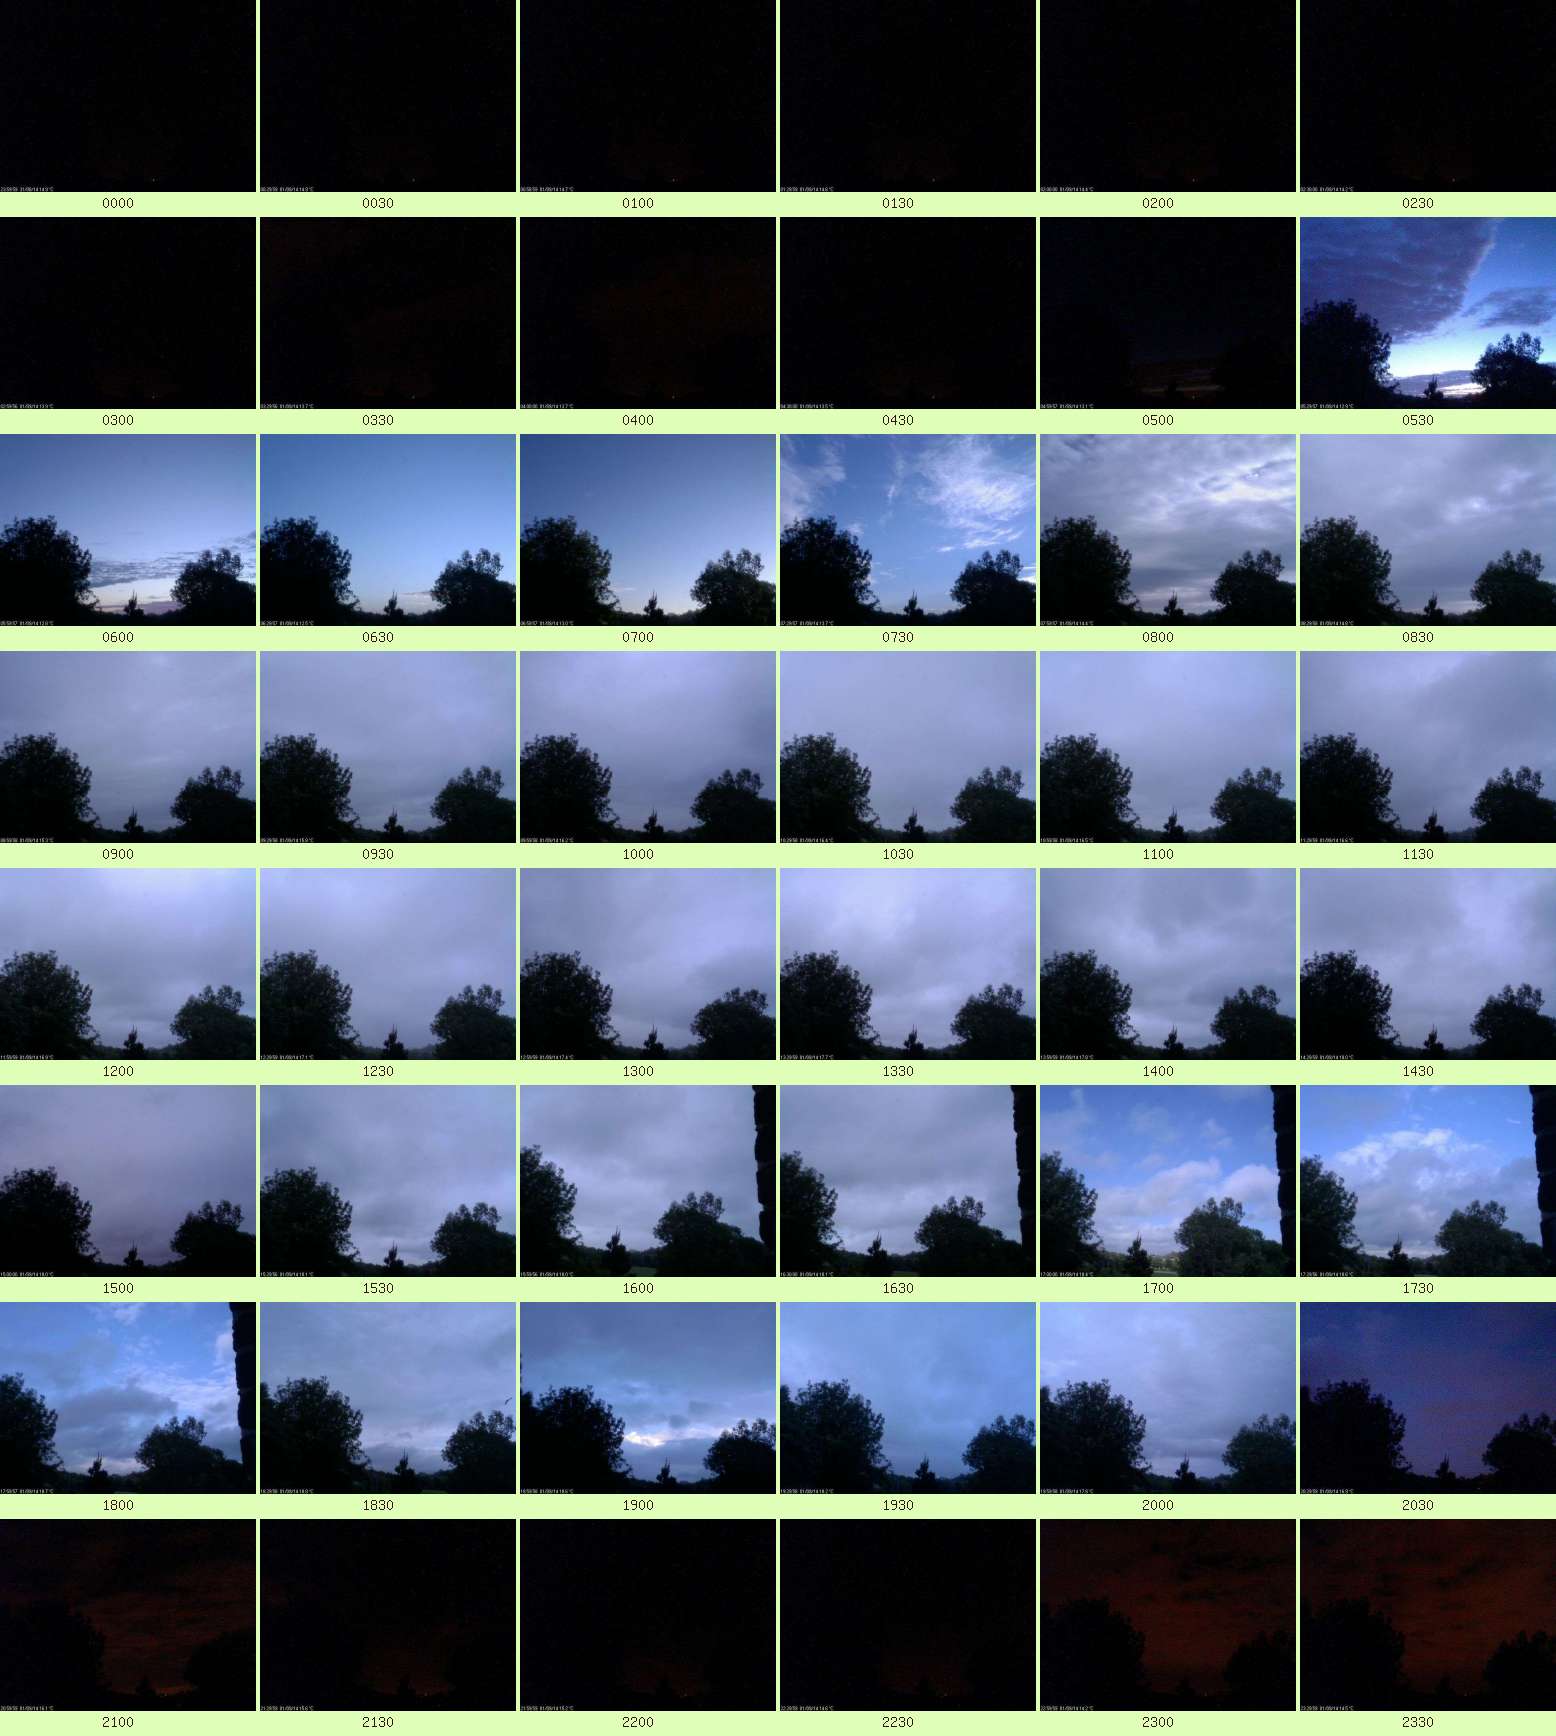