| Measure | Value (anomaly) | Time |
Month cumul. | Record High | Record Low |
| Minimum Temperature |
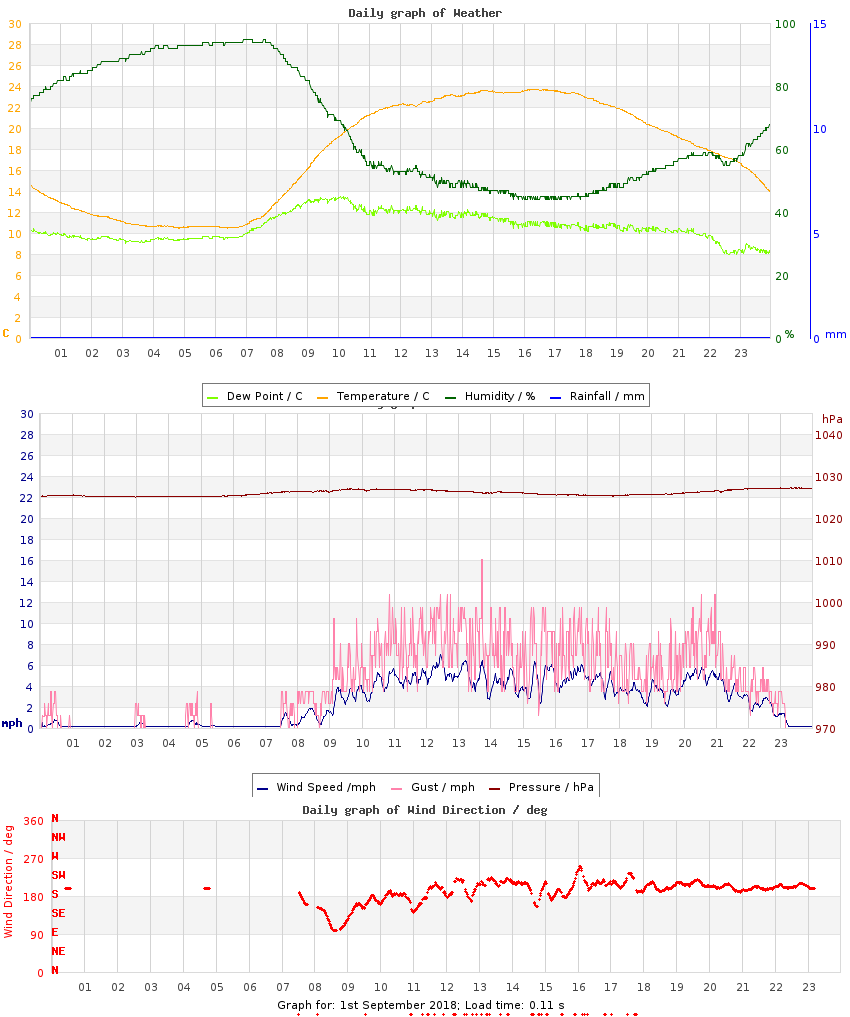
10.4 °C (-2.5) |
04:48 |
10.4 °C (-2.4) |
16.4 °C (+3.5), 2024 |
6.3 °C (-6.6), 2020 |
| Maximum Temperature |
23.7 °C (+2.4) |
16:18 |
23.7 °C (+2.5) |
27.4 °C (+6.1), 2024 |
17.8 °C (-3.5), 2015 |
| Mean Temperature |
17.5 °C (-0.0) |
|
17.5 °C (+0.0) |
21.1 °C, 2024 |
13.8 °C, 2020 |
| Minimum Humidity |
44% |
16:25 |
44% |
76%, 2014 |
40%, 2013 |
| Maximum Humidity |
95% |
07:02 |
95% |
96%, 2020 |
73%, 2013 |
| Mean Humidity |
67% |
|
67% |
89%, 2023 |
58%, 2013 |
| Minimum Pressure |
1025 hPa |
00:06 |
1025 hPa |
1030 hPa, 2021 |
1003 hPa, 2009 |
| Maximum Pressure |
1027 hPa |
23:26 |
1027 hPa |
1033 hPa, 2021 |
1007 hPa, 2025 |
| Mean Pressure |
1026 hPa |
|
1026 hPa |
1032 hPa, 2021 |
1005 hPa, 2025 |
| Mean Wind Speed |
2.5 mph (-1.4) |
|
2.5 mph (-1.4) |
6.3 mph, 2009 |
0.3 mph, 2020 |
| Maximum Wind Speed |
10.5 mph |
13:43 |
10.5 mph |
18.8 mph, 2025 |
5.2 mph, 2020 |
| Maximum Gust |
16.1 mph |
13:43 |
16.1 mph |
35.6 mph, 2009 |
8.1 mph, 2020 |
| Mean Wind Direction |
SSW |
|
|
|
|
| Rainfall |
0.0 mm |
|
0.0 mm (0%) |
5.8 mm, 2025 |
|
| Maximum Hourly Rain |
n/a |
|
|
4.5, 2015 |
|
| Maximum 10-min Rain |
n/a |
|
|
3.1, 2015 |
|
| Maximum Rain Rate |
n/a |
|
|
48, 2015 |
|
| Minimum Dew Point |
8.0 °C |
22:38 |
8.0 °C |
14.8 °C, 2024 |
3.4 °C, 2013 |
| Maximum Dew Point |
13.5 °C |
10:03 |
13.5 °C |
21.1 °C, 2024 |
9.8 °C, 2013 |
| Mean Dew Point |
10.6 °C |
|
10.6 °C |
17.9 °C, 2024 |
7.0 °C, 2013 |
| Measure | Value | Time |
Month cumul. | Record High | Record Low |
| Night Minimum (21-09) |
10.4 °C |
05:35 |
10.4 °C |
16.4 °C, 2024 |
6.3 °C, 2020 |
| Day Maximum (09-21) |
23.7 °C |
16:26 |
23.7 °C |
27.4 °C, 2024 |
17.8 °C, 2015 |
| Max 10m Temp Rise |
0.8 °C |
09:13 |
0.8 °C |
1.0 °C, 2010 |
0.4 °C, 2014 |
| Max 1hr Temp Rise |
3.5 °C |
09:22 |
3.5 °C |
4.5 °C, 2010 |
1.1 °C, 2015 |
| Max 1hr Hum Rise |
11% |
23:53 |
11% |
21%, 2025 |
4%, 2014 |
| Max 10m Temp Fall |
0.6 °C |
23:44 |
0.6 °C |
1.0 °C, 2025 |
0.2 °C, 2022 |
| Max 1hr Temp Fall |
2.8 °C |
23:59 |
2.8 °C |
4.0 °C, 2025 |
0.9 °C, 2021 |
| Max 1hr Hum Fall |
16% |
09:39 |
16% |
19%, 2020 |
3%, 2014 |
| Max 10m Wind Speed |
7.0 mph |
12:26 |
7.0 mph |
12.6 mph, 2025 |
2.9 mph, 2020 |
| Minimum Feels-like |
11.4 °C |
04:48 |
11.4 °C |
20.3 °C, 2024 |
6.3 °C, 2020 |
| Maximum Feels-like |
25.8 °C |
14:38 |
25.8 °C |
35.8 °C, 2024 |
20.5 °C, 2015 |
| Mean Feels-like |
19.1 °C |
|
19.1 °C |
27.1 °C, 2024 |
14.5 °C, 2020 |
| Air-frost Hrs |
0 hrs |
|
0 hrs |
0 hrs, 2009 |
0 hrs, 2009 |
| Measure | Value (anomaly) |
Month cumul. | Record High | Record Low |
| Temperature Range |
13.3 °C (+4.9) |
13.3 °C (+4.9) |
13.6 °C (+5.2), 2020 |
4.3 °C (-4.1), 2021 |
| Humidity Range |
51% |
51% |
51%, 2018 |
16%, 2021 |
| Pressure Range |
2 hPa |
2 hPa |
8 hPa, 2024 |
2 hPa, 2014 |
| Measure | Value [% of max] |
Month cumul. | Record High | Record Low |
| Sun Hours |
11.9 [96%] | 12 hrs (225%) [97%] |
12.2 [99%], 2010 |
0 [0%], 2021 |
| Wet Hours |
0 | 0 hrs (0%) [0%] |
5, 2014 |
0, 2010 |
| Cloud Cover |
Sunny with periods of Mostly Sunny |
| Events |
Maximum possible sunshine |
| Comments |
- |
| Extra Comments |
|
| Issues |
None known |
| Observer Absent? |
Yes - observations may be unreliable |
| Pond Temperature @ Hampstead Heath |
0.0 °C |


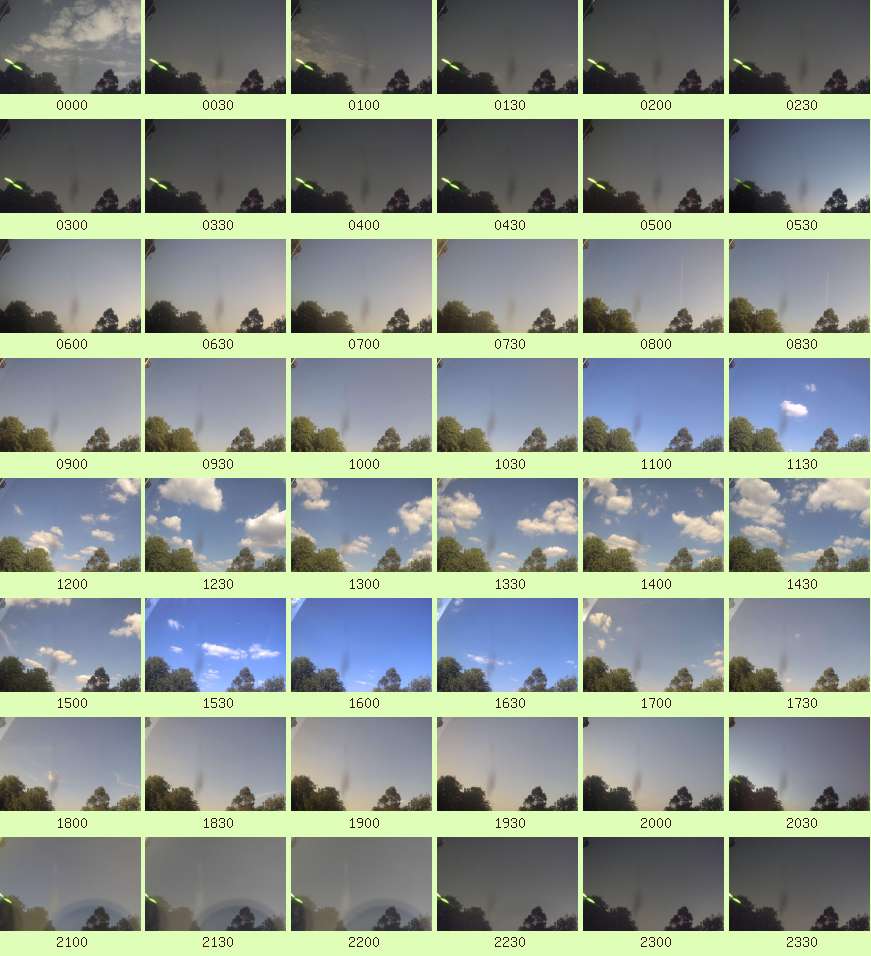 Full resolution individual images at up-to 5 minute intervals