| Measure | Value (anomaly) | Time |
Month cumul. | Record High | Record Low |
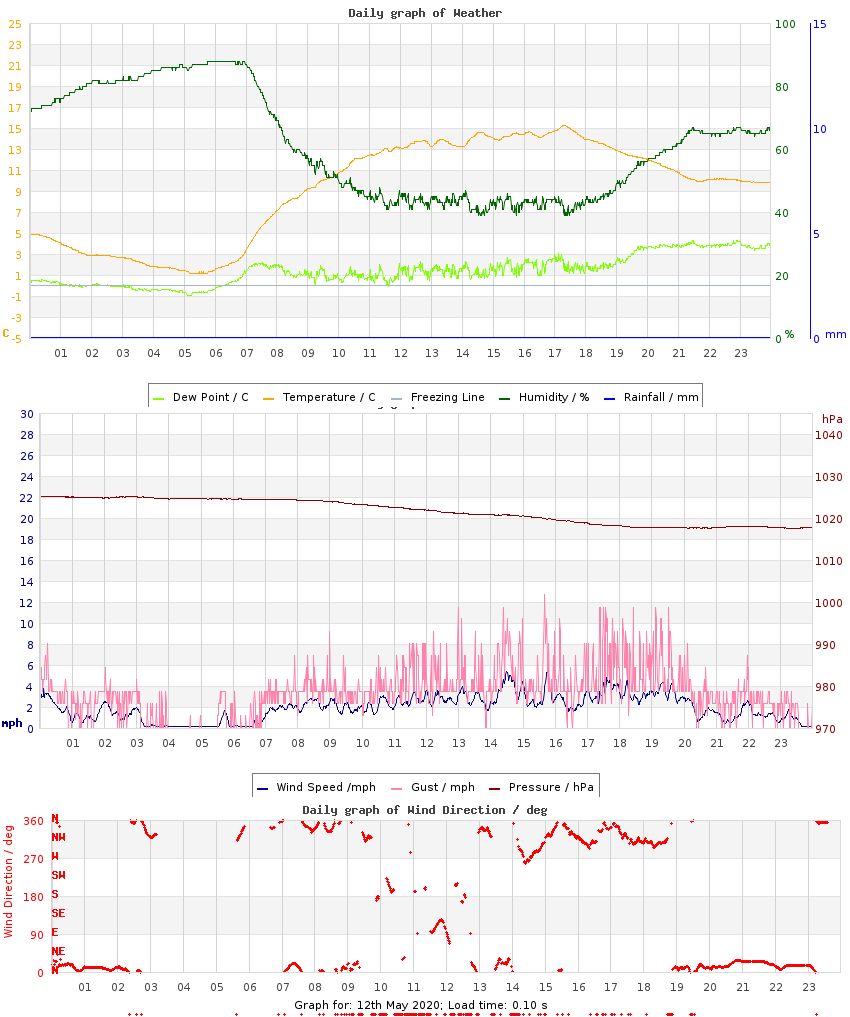
| Minimum Temperature |
1.2 °C (-7.4) |
05:25 |
6.4 °C (-1.6) |
12.6 °C (+4.0), 2017 |
1.0 °C (-7.6), 2010 |
| Maximum Temperature |
15.3 °C (-2.1) |
17:17 |
17.6 °C (+0.7) |
25.5 °C (+8.1), 2024 |
11.4 °C (-6.0), 2010 |
| Mean Temperature |
9.1 °C (-4.8) |
|
12.3 °C (-0.5) |
19.2 °C, 2024 |
6.9 °C, 2010 |
| Minimum Humidity |
39% |
14:36 |
45% |
79%, 2023 |
34%, 2009 |
| Maximum Humidity |
88% |
06:11 |
86% |
94%, 2016 |
74%, 2009 |
| Mean Humidity |
61% |
|
66% |
89%, 2023 |
52%, 2015 |
| Minimum Pressure |
1018 hPa |
23:18 |
1014 hPa |
1033 hPa, 2012 |
993 hPa, 2017 |
| Maximum Pressure |
1025 hPa |
00:29 |
1021 hPa |
1040 hPa, 2019 |
1002 hPa, 2017 |
| Mean Pressure |
1022 hPa |
|
1017 hPa |
1036 hPa, 2019 |
996 hPa, 2017 |
| Mean Wind Speed |
1.9 mph (-2.8) |
|
4.5 mph (-0.2) |
7.1 mph, 2015 |
1.9 mph, 2020 |
| Maximum Wind Speed |
9.7 mph |
17:22 |
13.1 mph |
17.8 mph, 2015 |
7.6 mph, 2010 |
| Maximum Gust |
12.7 mph |
15:40 |
20.3 mph |
27.5 mph, 2015 |
10.9 mph, 2010 |
| Mean Wind Direction |
N |
|
|
|
|
| Rainfall |
0.0 mm |
|
5.3 mm (30%) |
27.8 mm, 2025 |
|
| Maximum Hourly Rain |
n/a |
|
|
26.4, 2025 |
|
| Maximum 10-min Rain |
n/a |
|
|
10.6, 2025 |
|
| Maximum Rain Rate |
n/a |
|
|
96, 2025 |
|
| Minimum Dew Point |
-0.9 °C |
05:09 |
2.8 °C |
10.4 °C, 2016 |
-2.2 °C, 2010 |
| Maximum Dew Point |
4.3 °C |
21:27 |
8.3 °C |
16.1 °C, 2024 |
2.8 °C, 2010 |
| Mean Dew Point |
1.4 °C |
|
5.7 °C |
12.8 °C, 2024 |
0.1 °C, 2010 |
| Measure | Value | Time |
Month cumul. | Record High | Record Low |
| Night Minimum (21-09) |
1.2 °C |
05:27 |
7.1 °C |
14.0 °C, 2025 |
1.0 °C, 2010 |
| Day Maximum (09-21) |
15.3 °C |
17:18 |
17.6 °C |
25.5 °C, 2024 |
11.4 °C, 2010 |
| Max 10m Temp Rise |
0.9 °C |
07:11 |
0.8 °C |
0.9 °C, 2019 |
0.4 °C, 2018 |
| Max 1hr Temp Rise |
4.0 °C |
07:42 |
2.9 °C |
4.5 °C, 2019 |
1.1 °C, 2018 |
| Max 1hr Hum Rise |
11% |
19:42 |
11% |
30%, 2025 |
6%, 2009 |
| Max 10m Temp Fall |
0.5 °C |
12:58 |
0.8 °C |
2.0 °C, 2025 |
0.4 °C, 2009 |
| Max 1hr Temp Fall |
1.6 °C |
18:16 |
2.1 °C |
6.5 °C, 2025 |
1.3 °C, 2018 |
| Max 1hr Hum Fall |
21% |
08:16 |
15% |
22%, 2019 |
6%, 2023 |
| Max 10m Wind Speed |
5.4 mph |
15:45 |
9.4 mph |
14.9 mph, 2015 |
5.4 mph, 2020 |
| Minimum Feels-like |
-0.5 °C |
05:36 |
3.7 °C |
14.5 °C, 2025 |
-1.0 °C, 2010 |
| Maximum Feels-like |
15.3 °C |
17:15 |
18.2 °C |
29.4 °C, 2024 |
11.4 °C, 2010 |
| Mean Feels-like |
8.9 °C |
|
11.9 °C |
22.0 °C, 2024 |
6.0 °C, 2010 |
| Air-frost Hrs |
0 hrs |
|
0 hrs |
0 hrs, 2009 |
0 hrs, 2009 |
| Measure | Value (anomaly) |
Month cumul. | Record High | Record Low |
| Temperature Range |
14.1 °C (+5.3) |
11.2 °C (+2.3) |
14.1 °C (+5.3), 2020 |
1.4 °C (-7.4), 2016 |
| Humidity Range |
49% |
41% |
58%, 2019 |
15%, 2023 |
| Pressure Range |
8 hPa |
7 hPa |
9 hPa, 2019 |
2 hPa, 2018 |
| Measure | Value [% of max] |
Month cumul. | Record High | Record Low |
| Sun Hours |
9 [64%] | 105 hrs (147%) [63%] |
12 [86%], 2016 |
0.2 [1%], 2018 |
| Wet Hours |
0 | 2 hrs (13%) [0.7%] |
8, 2018 |
0, 2009 |
| Cloud Cover |
am: Sunny
pm: Partly Cloudy transitioned to Mostly Cloudy |
| Events |
None |
| Comments |
- |
| Extra Comments |
|
| Issues |
no pond temp due to covid |
| Observer Absent? |
Yes - observations may be unreliable |
| Pond Temperature @ Hampstead Heath |
5.0 °C |


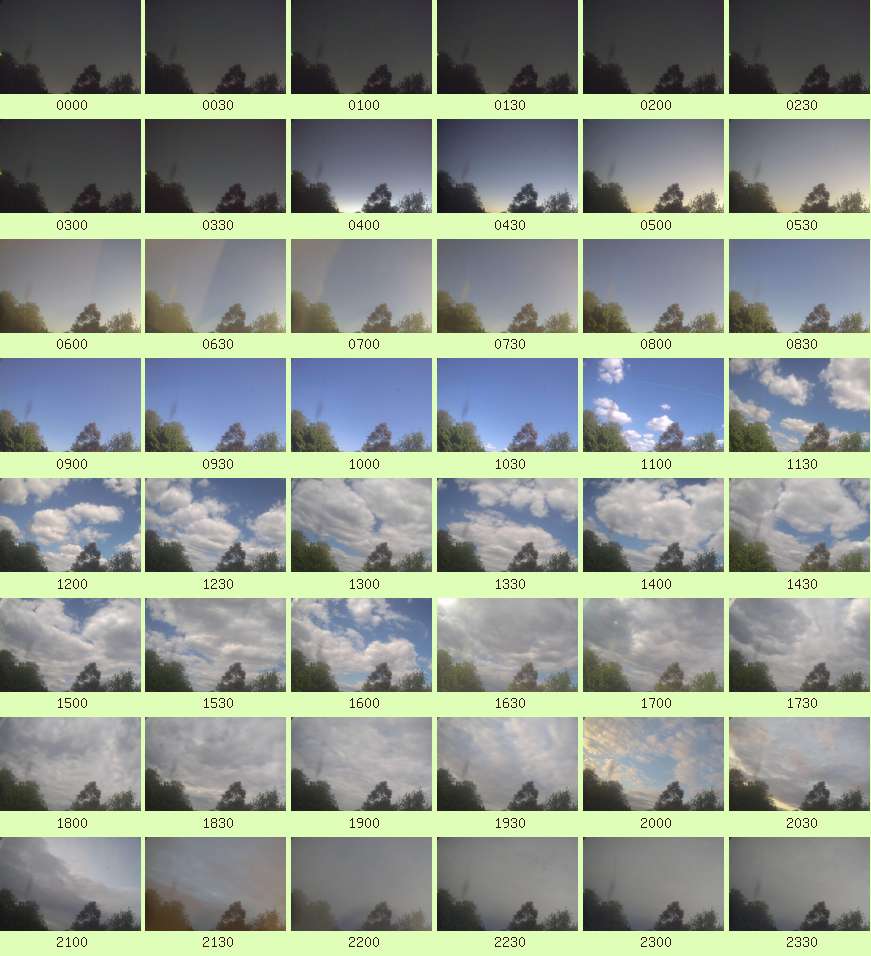 Full resolution individual images at up-to 5 minute intervals