| Measure | Value (anomaly) | Time |
Month cumul. | Record High | Record Low |
| Minimum Temperature |
1.4 °C (-1.6) |
02:15 |
3.0 °C (-0.1) |
8.0 °C (+5.0), 2025 |
-2.7 °C (-5.7), 2024 |
| Maximum Temperature |
5.4 °C (-2.4) |
23:46 |
8.8 °C (+0.9) |
12.3 °C (+4.5), 2020 |
1.6 °C (-6.2), 2013 |
| Mean Temperature |
3.7 °C (-2.0) |
|
5.9 °C (+0.4) |
10.3 °C, 2011 |
-0.1 °C, 2024 |
| Minimum Humidity |
86% |
16:00 |
80% |
98%, 2010 |
53%, 2015 |
| Maximum Humidity |
97% |
10:29 |
94% |
98%, 2010 |
83%, 2016 |
| Mean Humidity |
92% |
|
88% |
98%, 2010 |
74%, 2015 |
| Minimum Pressure |
1024 hPa |
19:33 |
1014 hPa |
1034 hPa, 2025 |
987 hPa, 2015 |
| Maximum Pressure |
1032 hPa |
00:01 |
1024 hPa |
1036 hPa, 2025 |
996 hPa, 2015 |
| Mean Pressure |
1027 hPa |
|
1019 hPa |
1035 hPa, 2025 |
990 hPa, 2015 |
| Mean Wind Speed |
0.9 mph (-4.3) |
|
4.4 mph (-0.8) |
10.8 mph, 2015 |
0.7 mph, 2021 |
| Maximum Wind Speed |
6.4 mph |
16:12 |
11.9 mph |
28.6 mph, 2020 |
6.1 mph, 2025 |
| Maximum Gust |
9.1 mph |
15:26 |
19.8 mph |
42.6 mph, 2020 |
9.1 mph, 2022 |
| Mean Wind Direction |
SW |
|
|
|
|
| Rainfall |
0.2 mm |
|
15.4 mm (54%) |
12.2 mm, 2026 |
|
| Maximum Hourly Rain |
0.2 mm |
|
|
3.6 mm, 2026 |
|
| Maximum 10-min Rain |
0.2 mm |
|
|
2.0 mm, 2018 |
|
| Maximum Rain Rate |
n/a |
|
|
66, 2018 |
|
| Minimum Dew Point |
0.5 °C |
02:15 |
1.4 °C |
7.1 °C, 2025 |
-6.1 °C, 2024 |
| Maximum Dew Point |
4.2 °C |
11:23 |
6.6 °C |
10.3 °C, 2020 |
-0.9 °C, 2024 |
| Mean Dew Point |
2.5 °C |
|
4.0 °C |
8.6 °C, 2014 |
-3.5 °C, 2024 |
| Measure | Value | Time |
Month cumul. | Record High | Record Low |
| Night Minimum (21-09) |
1.4 °C |
02:15 |
4.0 °C |
8.7 °C, 2025 |
-0.9 °C, 2024 |
| Day Maximum (09-21) |
* 5.2 °C * |
17:13 |
8.6 °C |
11.2 °C, 2011 |
1.6 °C, 2013 |
| Max 10m Temp Rise |
0.3 °C |
04:54 |
0.4 °C |
0.5 °C, 2012 |
0.1 °C, 2025 |
| Max 1hr Temp Rise |
0.7 °C |
04:54 |
1.2 °C |
1.9 °C, 2021 |
0.3 °C, 2025 |
| Max 1hr Hum Rise |
4% |
19:03 |
4% |
8%, 2016 |
0%, 2010 |
| Max 10m Temp Fall |
0.3 °C |
18:23 |
0.4 °C |
1.2 °C, 2020 |
0.2 °C, 2010 |
| Max 1hr Temp Fall |
1.0 °C |
18:37 |
1.4 °C |
3.1 °C, 2020 |
0.4 °C, 2011 |
| Max 1hr Hum Fall |
4% |
13:31 |
5% |
18%, 2012 |
0%, 2010 |
| Max 10m Wind Speed |
4.8 mph |
16:19 |
9.2 mph |
20.3 mph, 2020 |
4.8 mph, 2022 |
| Minimum Feels-like |
-1.0 °C |
04:12 |
0.1 °C |
5.5 °C, 2025 |
-6.8 °C, 2024 |
| Maximum Feels-like |
5.4 °C |
23:38 |
8.6 °C |
13.7 °C, 2020 |
0.9 °C, 2024 |
| Mean Feels-like |
3.2 °C |
|
4.6 °C |
9.9 °C, 2011 |
-3.2 °C, 2024 |
| Air-frost Hrs |
0 hrs |
|
0.8 hrs |
14 hrs, 2024 |
0 hrs, 2010 |
| Measure | Value (anomaly) |
Month cumul. | Record High | Record Low |
| Temperature Range |
4.0 °C (-0.8) |
5.7 °C (+1.0) |
8.8 °C (+4.0), 2017 |
1.4 °C (-3.4), 2025 |
| Humidity Range |
11% |
14% |
40%, 2015 |
0%, 2010 |
| Pressure Range |
7 hPa |
10 hPa |
22 hPa, 2020 |
2 hPa, 2009 |
| Measure | Value [% of max] |
Month cumul. | Record High | Record Low |
| Sun Hours |
0.8 [11%] | 45 hrs (139%) [41%] |
7.45 [100%], 2024 |
0 [0%], 2010 |
| Wet Hours |
0.5 | 19 hrs (57%) [5.1%] |
13, 2017 |
, 2009 |
| Cloud Cover |
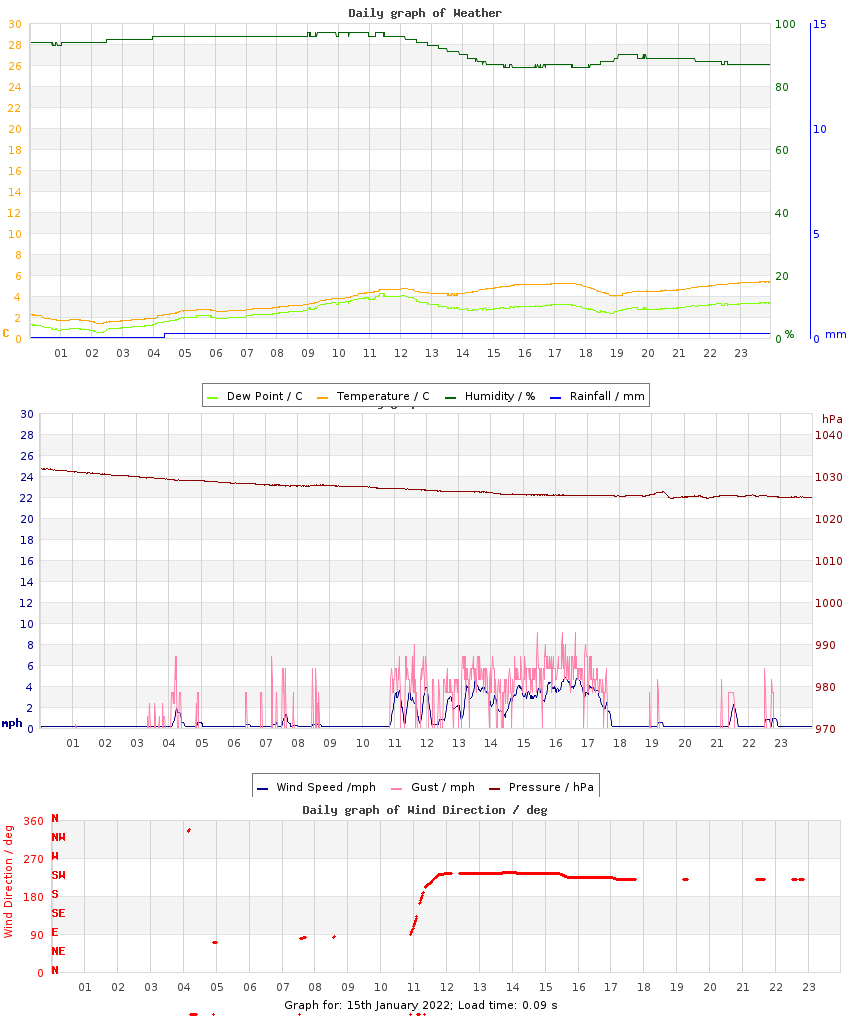
Overcast with periods of Mostly Cloudy |
| Events |
Dense Fog |
| Comments |
dense fog til 10; probably a fog tip |
| Extra Comments |
|
| Issues |
None known |
| Observer Absent? |
Yes - observations may be unreliable |
| Pond Temperature @ Hampstead Heath |
5.0 °C |


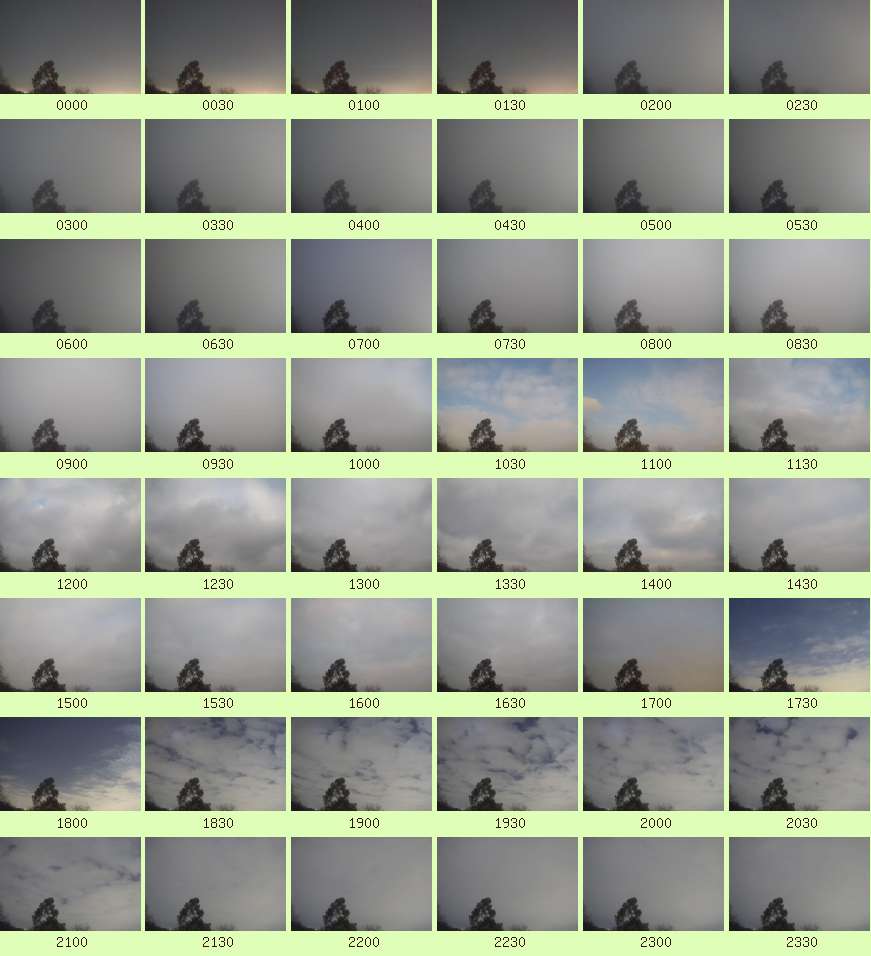 Full resolution individual images at up-to 5 minute intervals