| Measure | Value (anomaly) | Time |
Month cumul. | Record High | Record Low |
| Minimum Temperature |
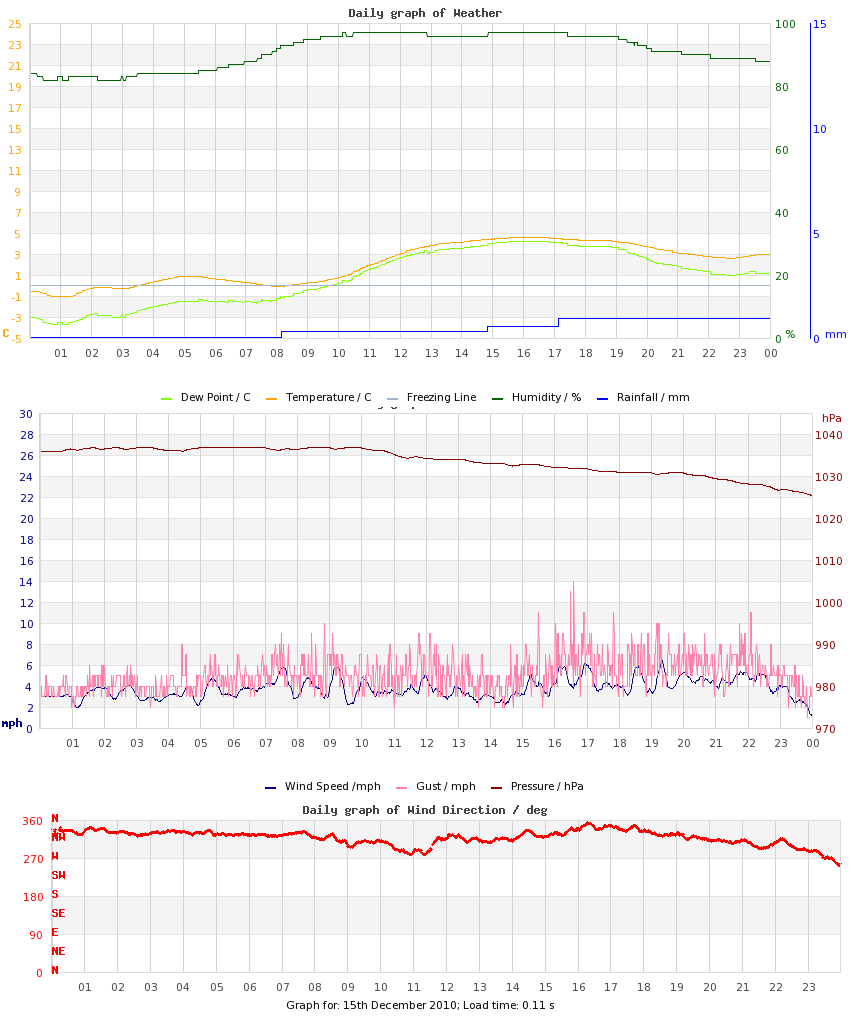
-1.0 °C (-4.6) |
01:01 |
-0.9 °C (-4.7) |
10.3 °C (+6.7), 2021 |
-5.1 °C (-8.7), 2022 |
| Maximum Temperature |
4.6 °C (-3.4) |
16:09 |
3.4 °C (-5.1) |
13.6 °C (+5.6), 2015 |
0.4 °C (-7.6), 2022 |
| Mean Temperature |
2.1 °C (-4.0) |
|
1.4 °C (-4.9) |
11.9 °C, 2021 |
-2.1 °C, 2022 |
| Minimum Humidity |
82% |
01:45 |
79% |
90%, 2013 |
65%, 2011 |
| Maximum Humidity |
97% |
13:45 |
94% |
97%, 2010 |
83%, 2016 |
| Mean Humidity |
91% |
|
87% |
95%, 2013 |
75%, 2011 |
| Minimum Pressure |
1026 hPa |
23:50 |
1014 hPa |
1030 hPa, 2023 |
984 hPa, 2012 |
| Maximum Pressure |
1037 hPa |
05:18 |
1020 hPa |
1040 hPa, 2023 |
997 hPa, 2012 |
| Mean Pressure |
1032 hPa |
|
1017 hPa |
1037 hPa, 2023 |
991 hPa, 2012 |
| Mean Wind Speed |
4.3 mph (-0.8) |
|
4.8 mph (-0.3) |
8.6 mph, 2018 |
2.2 mph, 2009 |
| Maximum Wind Speed |
9.2 mph |
|
11.6 mph |
19.2 mph, 2011 |
6.9 mph, 2009 |
| Maximum Gust |
16.3 mph |
16:35 |
16.8 mph |
30.0 mph, 2019 |
10.7 mph, 2009 |
| Mean Wind Direction |
NW |
|
|
|
|
| Rainfall |
0.8 mm |
|
6.5 mm (24%) |
11.2 mm, 2018 |
|
| Maximum Hourly Rain |
0.3 mm |
17:08 |
|
4.2 mm, 2019 |
|
| Maximum 10-min Rain |
n/a |
17:08 |
|
2.4, 2019 |
|
| Maximum Rain Rate |
n/a |
|
|
26, 2019 |
|
| Minimum Dew Point |
-3.7 °C |
00:57 |
-3.5 °C |
8.4 °C, 2021 |
-6.6 °C, 2022 |
| Maximum Dew Point |
4.2 °C |
16:09 |
1.7 °C |
12.2 °C, 2015 |
-1.7 °C, 2022 |
| Mean Dew Point |
0.8 °C |
|
-0.5 °C |
10.3 °C, 2013 |
-4.2 °C, 2022 |
| Measure | Value | Time |
Month cumul. | Record High | Record Low |
| Night Minimum (21-09) |
-1.0 °C |
|
-0.6 °C |
10.3 °C, 2021 |
-5.1 °C, 2022 |
| Day Maximum (09-21) |
4.6 °C |
|
3.1 °C |
12.9 °C, 2021 |
0.4 °C, 2022 |
| Max 10m Temp Rise |
0.3 °C |
11:38 |
0.2 °C |
0.5 °C, 2009 |
0.2 °C, 2015 |
| Max 1hr Temp Rise |
1.3 °C |
11:38 |
0.9 °C |
1.7 °C, 2022 |
0.4 °C, 2021 |
| Max 1hr Hum Rise |
5% |
08:07 |
5% |
9%, 2011 |
2%, 2013 |
| Max 10m Temp Fall |
0.2 °C |
19:44 |
0.3 °C |
1.2 °C, 2019 |
0.1 °C, 2015 |
| Max 1hr Temp Fall |
0.7 °C |
20:32 |
0.9 °C |
2.3 °C, 2019 |
0.2 °C, 2015 |
| Max 1hr Hum Fall |
4% |
19:58 |
5% |
7%, 2009 |
1%, 2015 |
| Max 10m Wind Speed |
6.5 mph |
19:20 |
8.0 mph |
14.3 mph, 2018 |
4.9 mph, 2009 |
| Minimum Feels-like |
-4.4 °C |
08:50 |
-5.0 °C |
11.2 °C, 2021 |
-10.5 °C, 2022 |
| Maximum Feels-like |
4.6 °C |
15:34 |
3.0 °C |
16.0 °C, 2015 |
0.4 °C, 2022 |
| Mean Feels-like |
-0.1 °C |
|
-1.0 °C |
12.9 °C, 2015 |
-4.3 °C, 2022 |
| Air-frost Hrs |
4 hrs |
|
10 hrs |
22 hrs, 2022 |
0 hrs, 2009 |
| Measure | Value (anomaly) |
Month cumul. | Record High | Record Low |
| Temperature Range |
5.6 °C (+1.2) |
4.3 °C (-0.4) |
6.5 °C (+2.1), 2024 |
1.1 °C (-3.3), 2025 |
| Humidity Range |
15% |
15% |
29%, 2018 |
3%, 2015 |
| Pressure Range |
11 hPa |
6 hPa |
21 hPa, 2017 |
2 hPa, 2009 |
| Measure | Value [% of max] |
Month cumul. | Record High | Record Low |
| Sun Hours |
0 [0%] | 19 hrs (60%) [18%] |
7 [100%], 2022 |
0 [0%], 2010 |
| Wet Hours |
3
[Mean rain rate: 0.3 mm/h] | 17 hrs (57%) [4.7%] |
7, 2018 |
0, 2009 |
| Cloud Cover |
Overcast |
| Events |
Air Frost |
| Comments |
13-18 broken Light Rain/Showers |
| Extra Comments |
|
| Issues |
None known |
| Observer Absent? |
Yes - observations may be unreliable |
| Pond Temperature @ Hampstead Heath |
0.0 °C |