| Measure | Value (anomaly) | Time |
Month cumul. | Record High | Record Low |
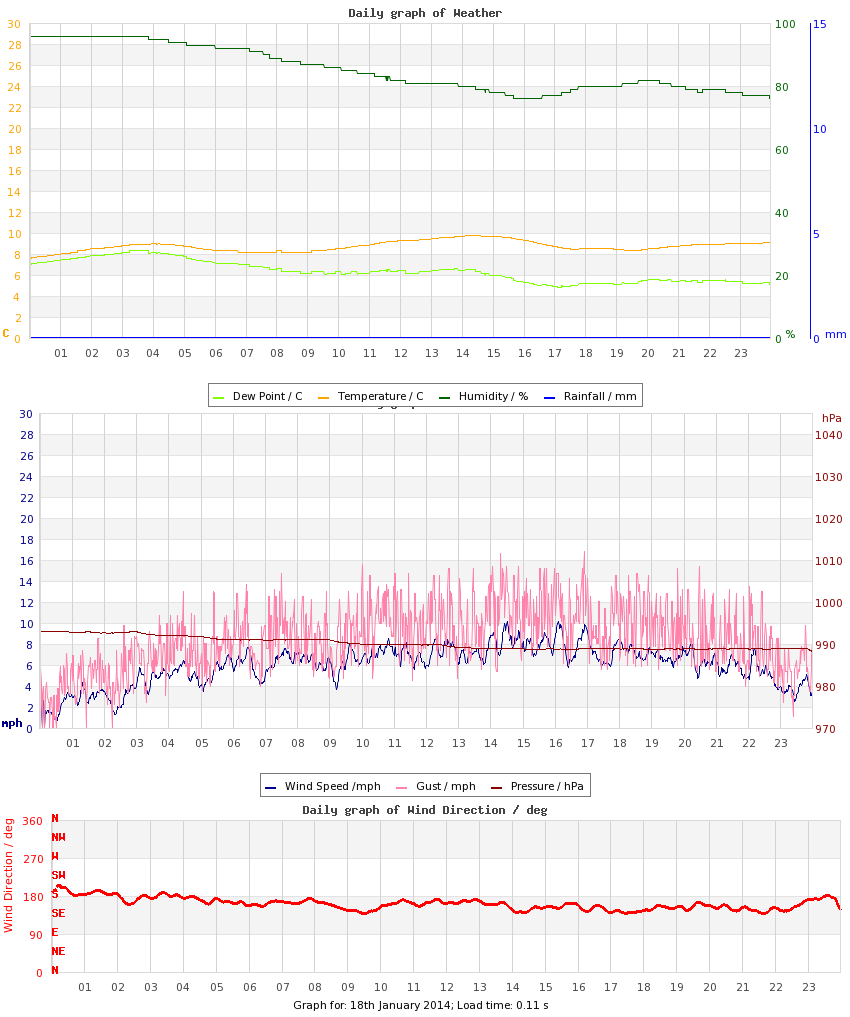
| Minimum Temperature |
7.6 °C (+4.6) |
00:01 |
5.1 °C (+2.0) |
7.6 °C (+4.6), 2014 |
-4.3 °C (-7.3), 2024 |
| Maximum Temperature |
9.8 °C (+2.0) |
14:21 |
10.2 °C (+2.3) |
11.9 °C (+4.1), 2012 |
1.8 °C (-6.0), 2013 |
| Mean Temperature |
8.7 °C (+3.3) |
|
7.8 °C (+2.2) |
9.3 °C, 2012 |
-1.4 °C, 2024 |
| Minimum Humidity |
76% |
16:10 |
75% |
95%, 2010 |
50%, 2009 |
| Maximum Humidity |
96% |
01:55 |
96% |
98%, 2010 |
82%, 2017 |
| Mean Humidity |
85% |
|
87% |
98%, 2010 |
70%, 2017 |
| Minimum Pressure |
989 hPa |
18:48 |
995 hPa |
1036 hPa, 2017 |
989 hPa, 2014 |
| Maximum Pressure |
993 hPa |
01:30 |
1006 hPa |
1040 hPa, 2022 |
993 hPa, 2014 |
| Mean Pressure |
990 hPa |
|
1000 hPa |
1038 hPa, 2017 |
990 hPa, 2014 |
| Mean Wind Speed |
6.0 mph (+0.8) |
|
6.9 mph (+1.7) |
10.4 mph, 2018 |
0.2 mph, 2017 |
| Maximum Wind Speed |
12.8 mph |
14:29 |
16.8 mph |
31.0 mph, 2018 |
3.8 mph, 2017 |
| Maximum Gust |
16.8 mph |
16:54 |
24.9 mph |
47.2 mph, 2018 |
5.2 mph, 2017 |
| Mean Wind Direction |
SSE |
|
|
|
|
| Rainfall |
trace |
|
86.8 mm (253%) |
7.6, 2011 |
|
| Maximum Hourly Rain |
n/a |
|
|
3, 2009 |
|
| Maximum 10-min Rain |
n/a |
|
|
1.1, 2011 |
|
| Maximum Rain Rate |
n/a |
|
|
10, 2011 |
|
| Minimum Dew Point |
4.8 °C |
17:09 |
3.1 °C |
5.4 °C, 2026 |
-7.5 °C, 2024 |
| Maximum Dew Point |
8.3 °C |
03:32 |
9.0 °C |
11.1 °C, 2012 |
-2.3 °C, 2013 |
| Mean Dew Point |
6.3 °C |
|
5.7 °C |
8.4 °C, 2012 |
-5.0 °C, 2017 |
| Measure | Value | Time |
Month cumul. | Record High | Record Low |
| Night Minimum (21-09) |
* 6.8 °C * |
22:46 |
6.0 °C |
6.8 °C, 2014 |
-4.3 °C, 2024 |
| Day Maximum (09-21) |
9.8 °C |
14:21 |
9.7 °C |
11.9 °C, 2012 |
-0.8 °C, 2013 |
| Max 10m Temp Rise |
0.2 °C |
01:57 |
0.3 °C |
0.9 °C, 2019 |
0.1 °C, 2013 |
| Max 1hr Temp Rise |
0.5 °C |
01:33 |
1.2 °C |
3.8 °C, 2019 |
0.4 °C, 2013 |
| Max 1hr Hum Rise |
3% |
17:31 |
7% |
6%, 2013 |
2%, 2010 |
| Max 10m Temp Fall |
0.2 °C |
16:19 |
0.5 °C |
0.4 °C, 2017 |
0.1 °C, 2012 |
| Max 1hr Temp Fall |
0.7 °C |
16:56 |
1.2 °C |
1.8 °C, 2018 |
0.3 °C, 2012 |
| Max 1hr Hum Fall |
3% |
07:46 |
8% |
15%, 2018 |
0%, 2010 |
| Max 10m Wind Speed |
10.2 mph |
16:05 |
12.3 mph |
23.3 mph, 2018 |
2.7 mph, 2017 |
| Minimum Feels-like |
4.7 °C |
07:29 |
1.5 °C |
4.7 °C, 2014 |
-10.2 °C, 2024 |
| Maximum Feels-like |
9.4 °C |
03:18 |
10.5 °C |
13.7 °C, 2012 |
-0.4 °C, 2013 |
| Mean Feels-like |
6.7 °C |
|
6.1 °C |
8.9 °C, 2012 |
-5.3 °C, 2013 |
| Air-frost Hrs |
0 hrs |
|
0.5 hrs |
18 hrs, 2013 |
0 hrs, 2010 |
| Measure | Value (anomaly) |
Month cumul. | Record High | Record Low |
| Temperature Range |
2.2 °C (-2.6) |
5.1 °C (+0.3) |
8.3 °C (+3.5), 2019 |
2.2 °C (-2.6), 2025 |
| Humidity Range |
20% |
20% |
44%, 2009 |
3%, 2010 |
| Pressure Range |
4 hPa |
11 hPa |
21 hPa, 2024 |
1 hPa, 2010 |
| Measure | Value [% of max] |
Month cumul. | Record High | Record Low |
| Sun Hours |
0.2 [3%] | 46 hrs (119%) [35%] |
7.6 [101%], 2020 |
0 [0%], 2012 |
| Wet Hours |
0.5 | 67 hrs (171%) [15%] |
10, 2013 |
, 2009 |
| Cloud Cover |
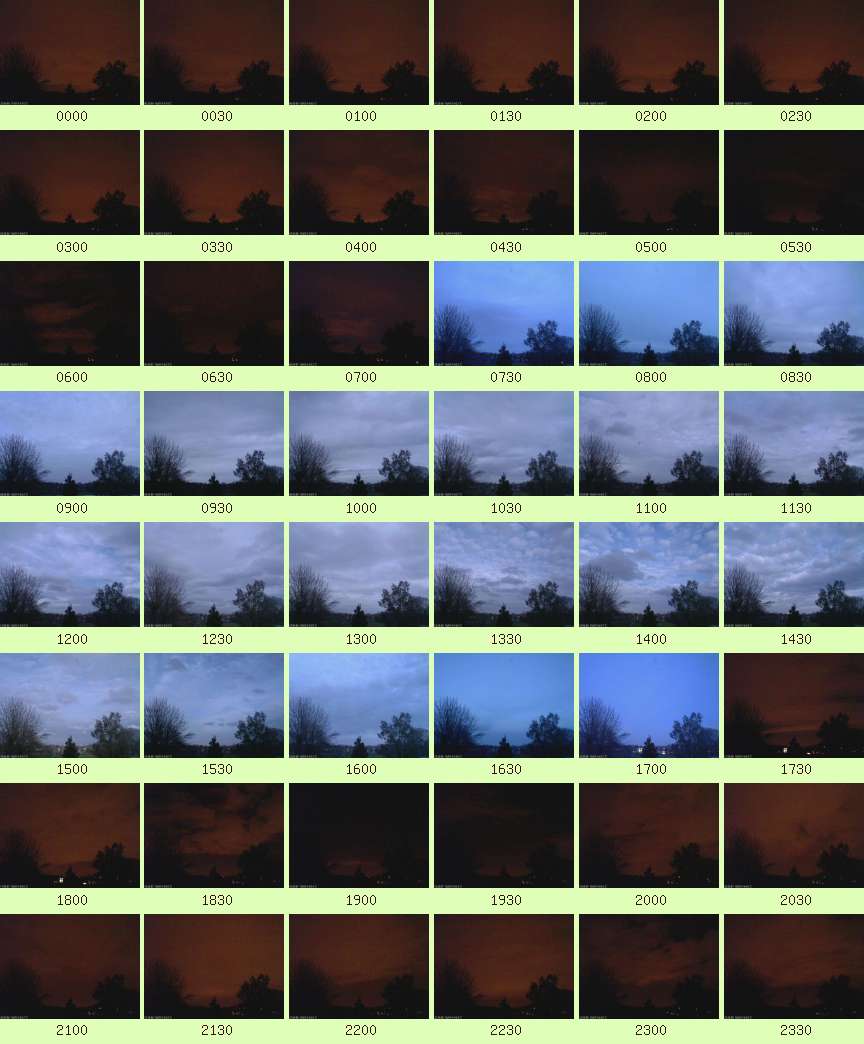
am: Overcast
pm: Mostly Cloudy |
| Events |
None |
| Comments |
00, 21 ish broken Slight Rain |
| Extra Comments |
|
| Issues |
None known |
| Observer Absent? |
No |
| Pond Temperature @ Hampstead Heath |
0.0 °C |


 Large resolution version
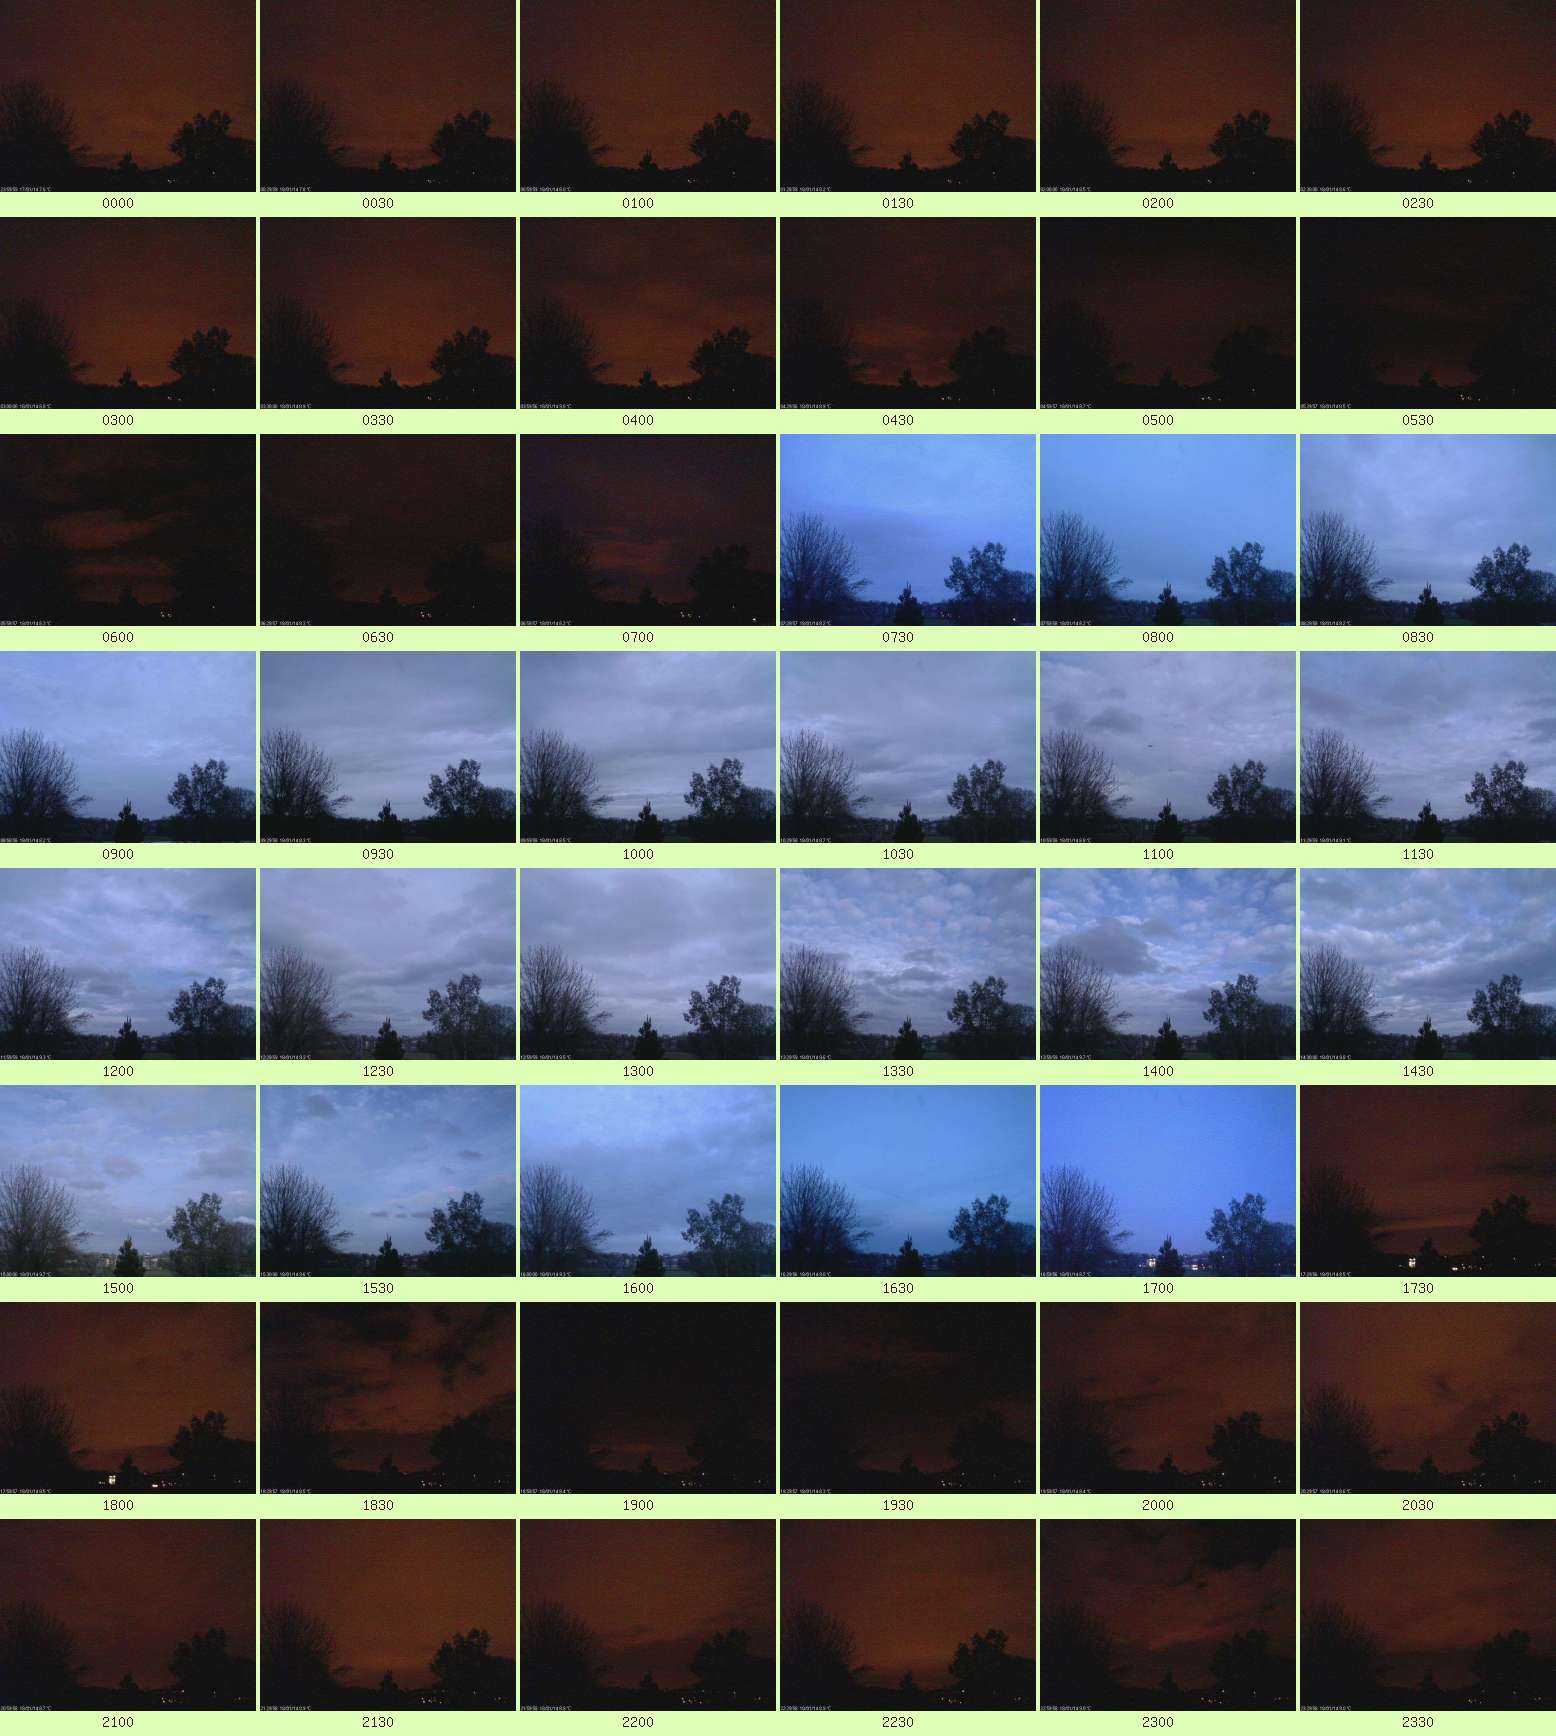