| Measure | Value (anomaly) | Time |
Month cumul. | Record High | Record Low |
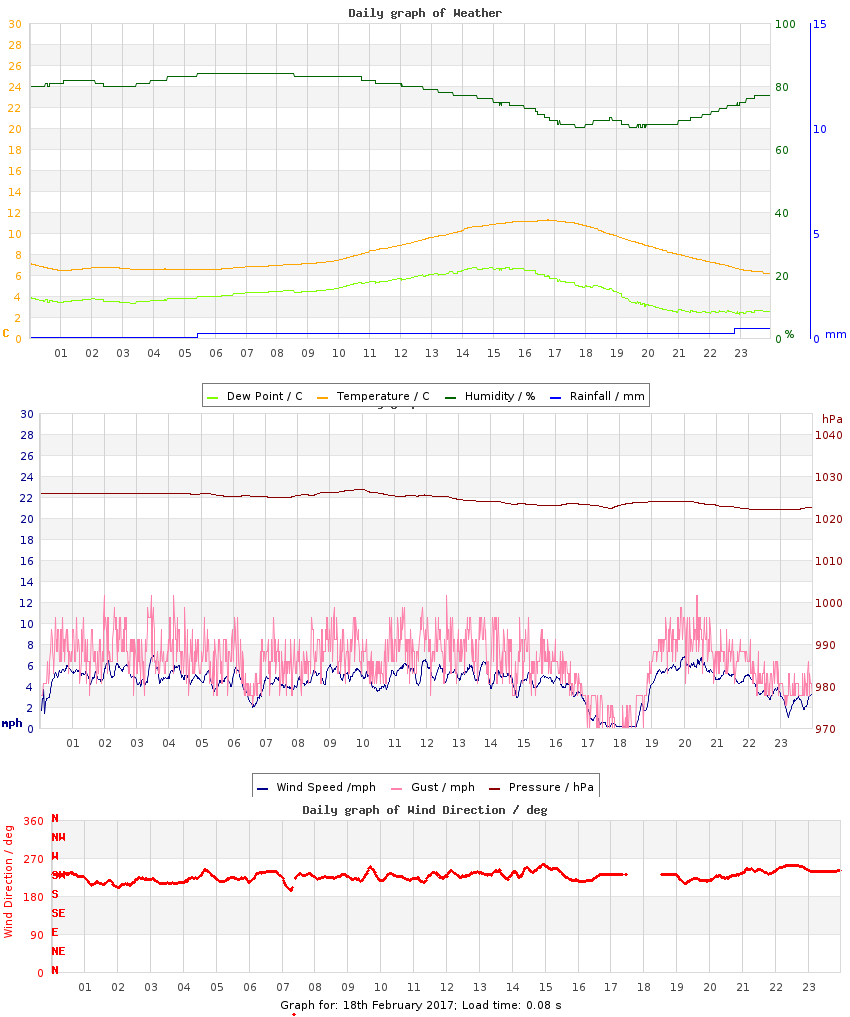
| Minimum Temperature |
6.2 °C (+3.4) |
23:52 |
4.2 °C (+1.3) |
9.4 °C (+6.6), 2023 |
-0.8 °C (-3.6), 2010 |
| Maximum Temperature |
11.3 °C (+3.1) |
16:47 |
8.3 °C (+0.3) |
14.9 °C (+6.7), 2024 |
4.8 °C (-3.4), 2010 |
| Mean Temperature |
8.1 °C (+3.2) |
|
6.2 °C (+0.8) |
11.7 °C, 2024 |
2.1 °C, 2010 |
| Minimum Humidity |
67% |
18:48 |
71% |
88%, 2010 |
51%, 2016 |
| Maximum Humidity |
84% |
06:59 |
85% |
98%, 2010 |
81%, 2015 |
| Mean Humidity |
78% |
|
80% |
96%, 2010 |
71%, 2015 |
| Minimum Pressure |
1022 hPa |
20:38 |
1013 hPa |
1031 hPa, 2015 |
986 hPa, 2010 |
| Maximum Pressure |
1027 hPa |
09:17 |
1020 hPa |
1042 hPa, 2015 |
992 hPa, 2010 |
| Mean Pressure |
1024 hPa |
|
1016 hPa |
1036 hPa, 2015 |
989 hPa, 2010 |
| Mean Wind Speed |
4.3 mph (-0.8) |
|
4.2 mph (-0.9) |
15.0 mph, 2022 |
1.7 mph, 2009 |
| Maximum Wind Speed |
8.8 mph |
03:31 |
10.6 mph |
44.1 mph, 2022 |
8.8 mph, 2017 |
| Maximum Gust |
12.6 mph |
02:00 |
16.3 mph |
63.9 mph, 2022 |
10.0 mph, 2009 |
| Mean Wind Direction |
SW |
|
|
|
|
| Rainfall |
0.0 mm |
|
17.3 mm (60%) |
11.6 mm, 2024 |
|
| Maximum Hourly Rain |
n/a |
|
|
4.3, 2014 |
|
| Maximum 10-min Rain |
n/a |
|
|
2.1, 2014 |
|
| Maximum Rain Rate |
n/a |
|
|
60, 2014 |
|
| Minimum Dew Point |
2.2 °C |
22:58 |
0.9 °C |
7.5 °C, 2024 |
-4.9 °C, 2016 |
| Maximum Dew Point |
6.7 °C |
14:55 |
4.8 °C |
12.2 °C, 2024 |
0.2 °C, 2025 |
| Mean Dew Point |
4.4 °C |
|
2.9 °C |
10.1 °C, 2024 |
-1.5 °C, 2025 |
| Measure | Value | Time |
Month cumul. | Record High | Record Low |
| Night Minimum (21-09) |
* 6.4 °C * |
01:07 |
4.5 °C |
10.7 °C, 2023 |
-0.8 °C, 2010 |
| Day Maximum (09-21) |
11.3 °C |
16:47 |
8.2 °C |
14.9 °C, 2024 |
4.8 °C, 2010 |
| Max 10m Temp Rise |
0.2 °C |
10:59 |
0.3 °C |
1.3 °C, 2009 |
0.2 °C, 2017 |
| Max 1hr Temp Rise |
0.9 °C |
10:59 |
1.1 °C |
3.7 °C, 2018 |
0.5 °C, 2019 |
| Max 1hr Hum Rise |
4% |
22:19 |
4% |
16%, 2022 |
2%, 2010 |
| Max 10m Temp Fall |
0.3 °C |
18:40 |
0.3 °C |
1.7 °C, 2012 |
0.2 °C, 2010 |
| Max 1hr Temp Fall |
1.1 °C |
19:28 |
0.9 °C |
3.6 °C, 2012 |
0.7 °C, 2010 |
| Max 1hr Hum Fall |
5% |
16:50 |
6% |
13%, 2016 |
1%, 2010 |
| Max 10m Wind Speed |
6.9 mph |
03:32 |
8.2 mph |
29.5 mph, 2022 |
5.7 mph, 2010 |
| Minimum Feels-like |
2.9 °C |
03:27 |
0.9 °C |
7.5 °C, 2024 |
-4.0 °C, 2025 |
| Maximum Feels-like |
11.3 °C |
16:46 |
8.2 °C |
16.7 °C, 2024 |
3.0 °C, 2026 |
| Mean Feels-like |
6.6 °C |
|
4.5 °C |
13.0 °C, 2024 |
-0.2 °C, 2025 |
| Air-frost Hrs |
0 hrs |
|
0 hrs |
8 hrs, 2010 |
0 hrs, 2009 |
| Measure | Value (anomaly) |
Month cumul. | Record High | Record Low |
| Temperature Range |
5.1 °C (-0.3) |
4.1 °C (-1.0) |
8.4 °C (+3.0), 2018 |
3.2 °C (-2.2), 2026 |
| Humidity Range |
17% |
14% |
41%, 2016 |
8%, 2019 |
| Pressure Range |
5 hPa |
7 hPa |
24 hPa, 2022 |
1 hPa, 2009 |
| Measure | Value [% of max] |
Month cumul. | Record High | Record Low |
| Sun Hours |
2.5 [28%] | 27 hrs (55%) [17%] |
9 [99%], 2015 |
0 [0%], 2019 |
| Wet Hours |
0 | 54 hrs (162%) [13%] |
9, 2024 |
, 2009 |
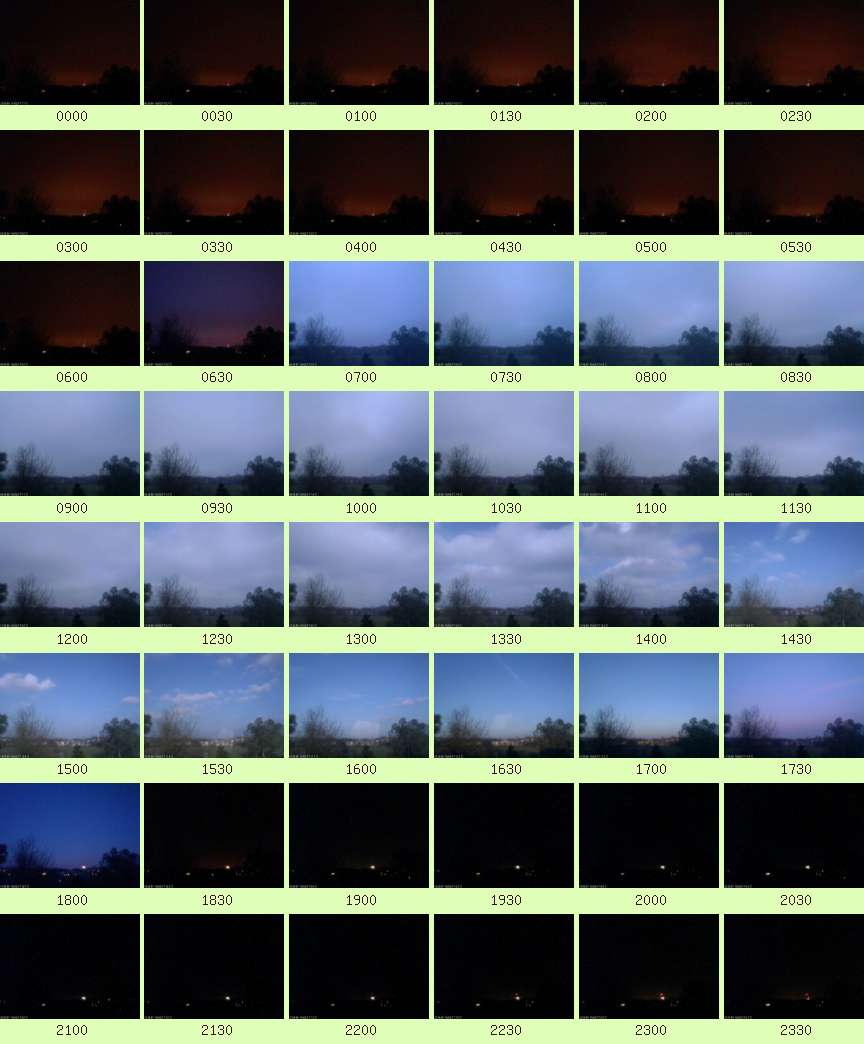
| Cloud Cover |
am: Overcast
pm: Mostly Cloudy transitioned to Sunny |
| Events |
None |
| Comments |
- |
| Extra Comments |
mysterious false tips removed |
| Issues |
None known |
| Observer Absent? |
Yes - observations may be unreliable |
| Pond Temperature @ Hampstead Heath |
0.0 °C |


 Large resolution version
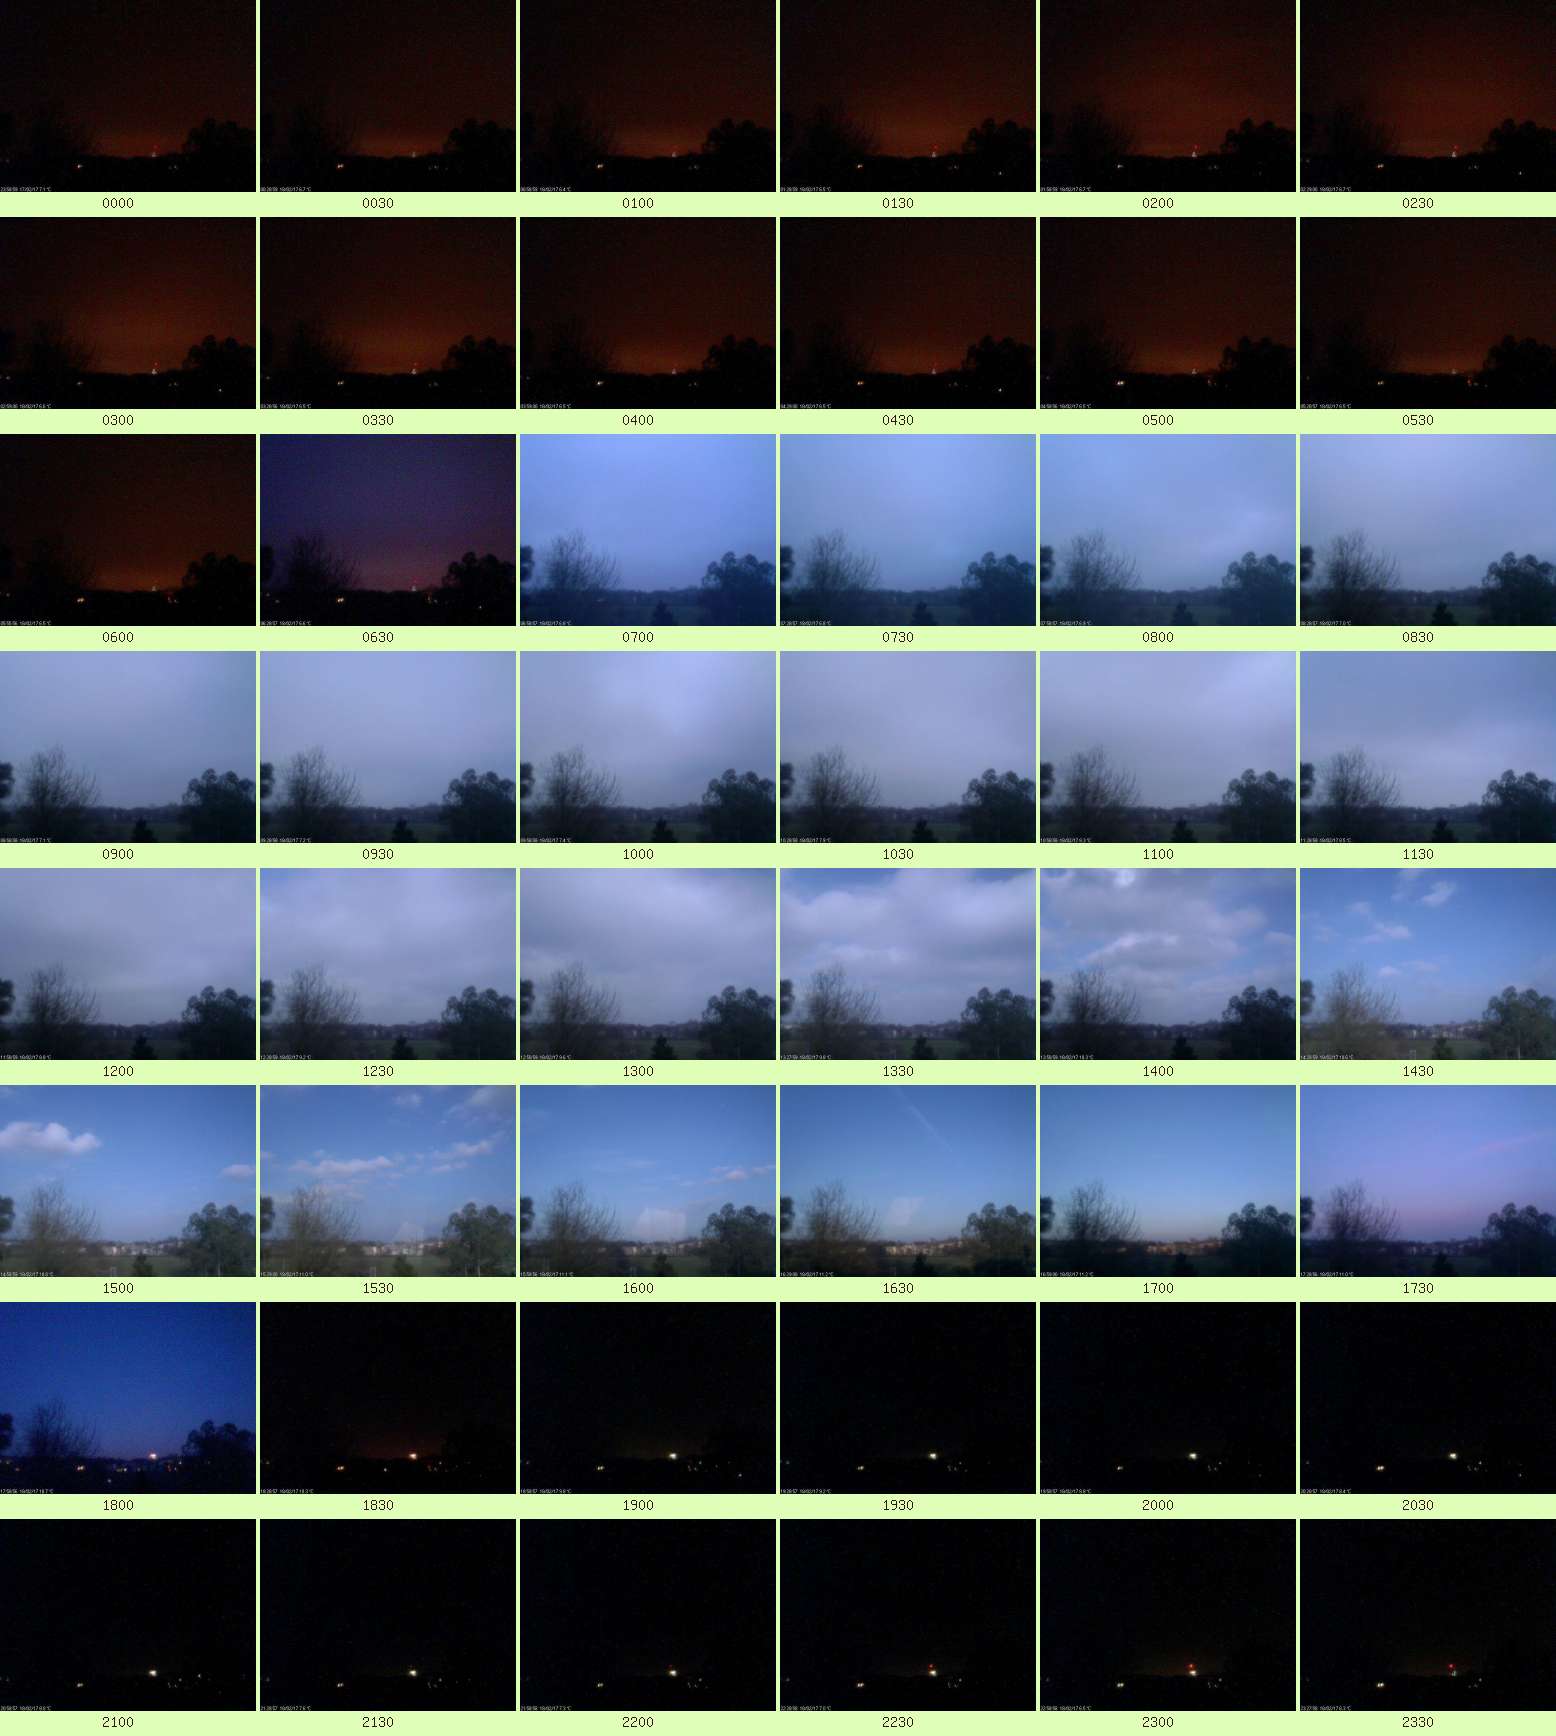