| Measure | Value (anomaly) | Time |
Month cumul. | Record High | Record Low |
| Minimum Temperature |
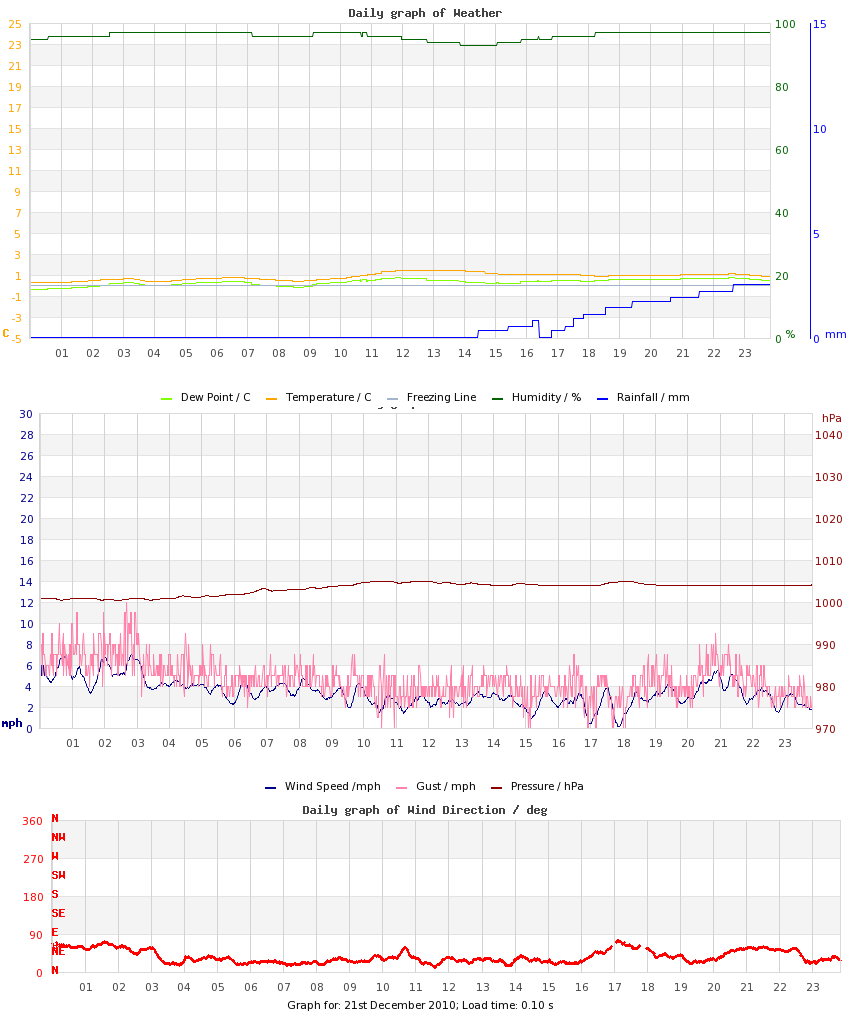
0.3 °C (-3.1) |
00:41 |
-1.9 °C (-5.6) |
10.1 °C (+6.7), 2023 |
-2.9 °C (-6.3), 2009 |
| Maximum Temperature |
1.4 °C (-6.3) |
13:00 |
2.8 °C (-5.5) |
13.6 °C (+5.9), 2023 |
1.4 °C (-6.3), 2010 |
| Mean Temperature |
0.9 °C (-4.7) |
|
0.7 °C (-5.6) |
11.6 °C, 2023 |
-0.5 °C, 2009 |
| Minimum Humidity |
93% |
14:33 |
80% |
93%, 2010 |
68%, 2023 |
| Maximum Humidity |
97% |
13:16 |
94% |
98%, 2009 |
83%, 2016 |
| Mean Humidity |
96% |
|
88% |
96%, 2010 |
79%, 2016 |
| Minimum Pressure |
1000 hPa |
01:55 |
1009 hPa |
1035 hPa, 2017 |
972 hPa, 2019 |
| Maximum Pressure |
1004 hPa |
16:50 |
1015 hPa |
1036 hPa, 2017 |
986 hPa, 2019 |
| Mean Pressure |
1002 hPa |
|
1012 hPa |
1035 hPa, 2017 |
980 hPa, 2019 |
| Mean Wind Speed |
3.9 mph (-1.2) |
|
4.7 mph (-0.4) |
11.9 mph, 2013 |
0.3 mph, 2021 |
| Maximum Wind Speed |
10.9 mph |
|
11.5 mph |
23.3 mph, 2018 |
5.5 mph, 2021 |
| Maximum Gust |
13.2 mph |
02:42 |
16.5 mph |
39.2 mph, 2018 |
10.2 mph, 2009 |
| Mean Wind Direction |
NE |
|
|
|
|
| Rainfall |
0.3 mm |
|
20.1 mm (52%) |
9.5 mm, 2018 |
|
| Maximum Hourly Rain |
n/a |
17:40 |
|
4.4, 2018 |
|
| Maximum 10-min Rain |
n/a |
17:40 |
|
1.2, 2013 |
|
| Maximum Rain Rate |
n/a |
17:40 |
|
54, 2013 |
|
| Minimum Dew Point |
-0.4 °C |
00:17 |
-4.3 °C |
8.3 °C, 2017 |
-4.4 °C, 2009 |
| Maximum Dew Point |
0.8 °C |
17:21 |
1.2 °C |
12.2 °C, 2020 |
0.8 °C, 2010 |
| Mean Dew Point |
0.3 °C |
|
-1.2 °C |
9.8 °C, 2020 |
-1.5 °C, 2009 |
| Measure | Value | Time |
Month cumul. | Record High | Record Low |
| Night Minimum (21-09) |
* -0.1 °C * |
|
-1.3 °C |
10.1 °C, 2017 |
-2.9 °C, 2009 |
| Day Maximum (09-21) |
1.4 °C |
|
2.6 °C |
13.6 °C, 2023 |
1.4 °C, 2010 |
| Max 10m Temp Rise |
0.1 °C |
06:13 |
0.2 °C |
1.3 °C, 2009 |
0.1 °C, 2010 |
| Max 1hr Temp Rise |
0.5 °C |
11:13 |
0.9 °C |
1.9 °C, 2009 |
0.4 °C, 2017 |
| Max 1hr Hum Rise |
2% |
15:57 |
5% |
10%, 2013 |
2%, 2010 |
| Max 10m Temp Fall |
0.1 °C |
06:56 |
0.3 °C |
1.3 °C, 2009 |
0.1 °C, 2010 |
| Max 1hr Temp Fall |
0.3 °C |
04:02 |
1.0 °C |
2.0 °C, 2021 |
0.3 °C, 2010 |
| Max 1hr Hum Fall |
2% |
12:53 |
5% |
16%, 2024 |
2%, 2010 |
| Max 10m Wind Speed |
7.0 mph |
02:51 |
8.0 mph |
18.8 mph, 2018 |
3.5 mph, 2021 |
| Minimum Feels-like |
-4.5 °C |
01:09 |
-5.9 °C |
10.1 °C, 2023 |
-5.7 °C, 2009 |
| Maximum Feels-like |
1.4 °C |
11:54 |
2.5 °C |
15.7 °C, 2020 |
1.4 °C, 2010 |
| Mean Feels-like |
-1.2 °C |
|
-1.7 °C |
12.2 °C, 2023 |
-1.2 °C, 2010 |
| Air-frost Hrs |
0 hrs |
|
11 hrs |
13 hrs, 2009 |
0 hrs, 2010 |
| Measure | Value (anomaly) |
Month cumul. | Record High | Record Low |
| Temperature Range |
1.1 °C (-3.2) |
4.7 °C (+0.1) |
7.0 °C (+2.7), 2014 |
1.1 °C (-3.2), 2010 |
| Humidity Range |
4% |
15% |
23%, 2018 |
4%, 2010 |
| Pressure Range |
4 hPa |
7 hPa |
13 hPa, 2019 |
1 hPa, 2017 |
| Measure | Value [% of max] |
Month cumul. | Record High | Record Low |
| Sun Hours |
0 [0%] | 23 hrs (51%) [15%] |
2.5 [36%], 2012 |
0 [0%], 2009 |
| Wet Hours |
1 | 29 hrs (69%) [5.7%] |
12, 2013 |
0, 2012 |
| Cloud Cover |
Overcast |
| Events |
Lying Snow (at 09z): ~3 cm
Air Frost |
| Comments |
Lying Snow:3cm; 17-18 Drizzle (possible Sleety mix) |
| Extra Comments |
|
| Issues |
Rain total is an estimate due to accompanying snow melt |
| Observer Absent? |
No |
| Pond Temperature @ Hampstead Heath |
0.0 °C |