| Measure | Value (anomaly) | Time |
Month cumul. | Record High | Record Low |
| Minimum Temperature |
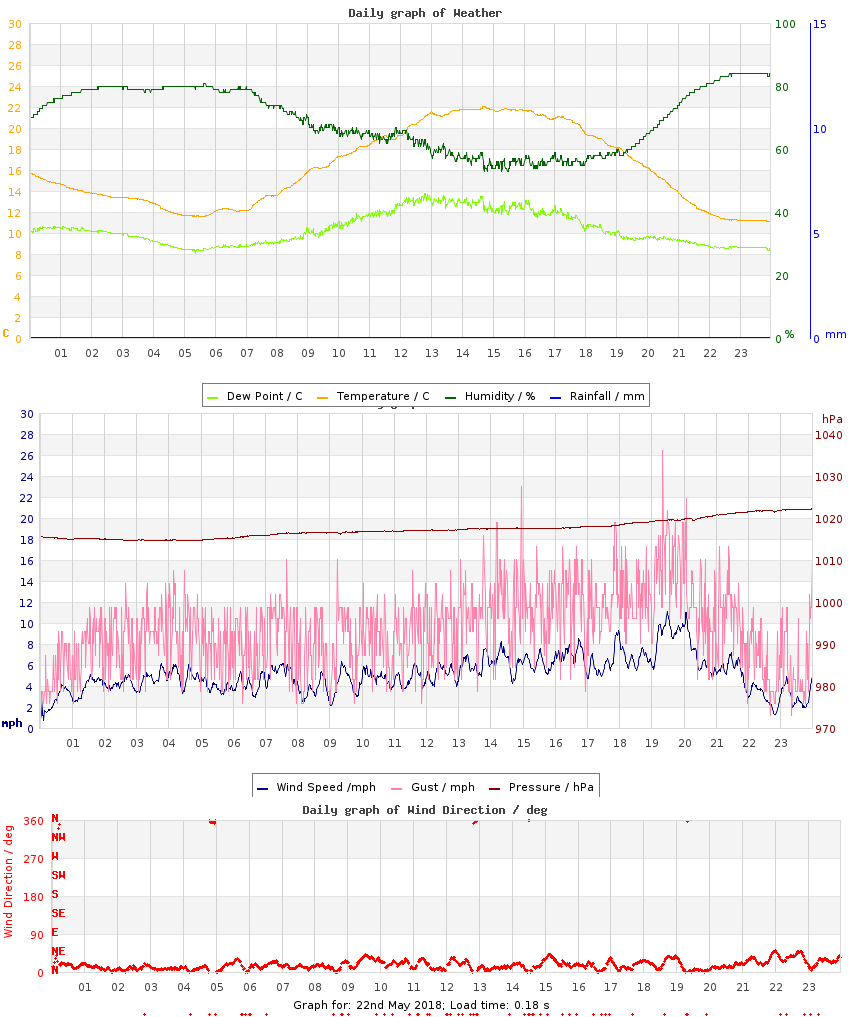
11.0 °C (+1.2) |
23:59 |
7.7 °C (-0.8) |
14.2 °C (+4.4), 2020 |
4.8 °C (-5.0), 2025 |
| Maximum Temperature |
22.1 °C (+3.7) |
14:42 |
19.8 °C (+2.5) |
25.2 °C (+6.8), 2017 |
14.2 °C (-4.2), 2013 |
| Mean Temperature |
16.1 °C (+2.5) |
|
14.1 °C (+0.8) |
19.1 °C, 2020 |
10.7 °C, 2021 |
| Minimum Humidity |
53% |
15:28 |
43% |
91%, 2024 |
35%, 2011 |
| Maximum Humidity |
84% |
23:16 |
89% |
96%, 2024 |
75%, 2020 |
| Mean Humidity |
70% |
|
65% |
94%, 2024 |
54%, 2019 |
| Minimum Pressure |
1015 hPa |
03:43 |
1016 hPa |
1027 hPa, 2010 |
997 hPa, 2021 |
| Maximum Pressure |
1022 hPa |
23:55 |
1022 hPa |
1031 hPa, 2010 |
1003 hPa, 2014 |
| Mean Pressure |
1017 hPa |
|
1019 hPa |
1029 hPa, 2010 |
1001 hPa, 2014 |
| Mean Wind Speed |
5.1 mph (+0.4) |
|
3.9 mph (-0.8) |
9.1 mph, 2011 |
2.0 mph, 2025 |
| Maximum Wind Speed |
15.9 mph |
20:03 |
11.7 mph |
21.0 mph, 2011 |
9.4 mph, 2010 |
| Maximum Gust |
26.5 mph |
19:20 |
18.4 mph |
33.8 mph, 2011 |
13.6 mph, 2010 |
| Mean Wind Direction |
NNE |
|
|
|
|
| Rainfall |
0.0 mm |
|
14.1 mm (43%) |
12.1 mm, 2024 |
|
| Maximum Hourly Rain |
n/a |
|
|
3.4, 2024 |
|
| Maximum 10-min Rain |
n/a |
|
|
1.7, 2014 |
|
| Maximum Rain Rate |
n/a |
|
|
66, 2024 |
|
| Minimum Dew Point |
8.1 °C |
05:21 |
4.5 °C |
11.6 °C, 2024 |
0.0 °C, 2013 |
| Maximum Dew Point |
13.8 °C |
12:47 |
10.1 °C |
15.5 °C, 2012 |
8.2 °C, 2009 |
| Mean Dew Point |
10.4 °C |
|
7.1 °C |
12.9 °C, 2024 |
5.4 °C, 2013 |
| Measure | Value | Time |
Month cumul. | Record High | Record Low |
| Night Minimum (21-09) |
* 11.6 °C * |
05:28 |
8.1 °C |
17.2 °C, 2020 |
4.8 °C, 2025 |
| Day Maximum (09-21) |
22.1 °C |
14:42 |
19.8 °C |
25.2 °C, 2017 |
14.2 °C, 2013 |
| Max 10m Temp Rise |
0.8 °C |
12:14 |
0.8 °C |
1.0 °C, 2012 |
0.2 °C, 2024 |
| Max 1hr Temp Rise |
2.3 °C |
09:00 |
2.9 °C |
3.9 °C, 2012 |
0.6 °C, 2024 |
| Max 1hr Hum Rise |
10% |
20:44 |
11% |
21%, 2014 |
2%, 2024 |
| Max 10m Temp Fall |
0.9 °C |
17:59 |
0.7 °C |
2.3 °C, 2014 |
0.3 °C, 2015 |
| Max 1hr Temp Fall |
2.6 °C |
21:13 |
2.2 °C |
4.4 °C, 2014 |
0.7 °C, 2024 |
| Max 1hr Hum Fall |
8% |
13:02 |
16% |
24%, 2022 |
3%, 2024 |
| Max 10m Wind Speed |
11.1 mph |
19:28 |
8.6 mph |
14.7 mph, 2020 |
6.2 mph, 2012 |
| Minimum Feels-like |
11.6 °C |
23:59 |
6.4 °C |
15.2 °C, 2020 |
3.6 °C, 2025 |
| Maximum Feels-like |
25.1 °C |
14:40 |
20.8 °C |
28.7 °C, 2012 |
14.2 °C, 2013 |
| Mean Feels-like |
17.6 °C |
|
14.3 °C |
20.2 °C, 2020 |
9.8 °C, 2021 |
| Air-frost Hrs |
0 hrs |
|
0 hrs |
0 hrs, 2009 |
0 hrs, 2009 |
| Measure | Value (anomaly) |
Month cumul. | Record High | Record Low |
| Temperature Range |
11.1 °C (+2.5) |
12.1 °C (+3.3) |
14.4 °C (+5.8), 2017 |
1.9 °C (-6.7), 2024 |
| Humidity Range |
31% |
46% |
58%, 2022 |
5%, 2024 |
| Pressure Range |
8 hPa |
6 hPa |
13 hPa, 2021 |
3 hPa, 2013 |
| Measure | Value [% of max] |
Month cumul. | Record High | Record Low |
| Sun Hours |
14 [97%] | 209 hrs (158%) [68%] |
14.5 [100%], 2010 |
0 [0%], 2024 |
| Wet Hours |
0 | 17 hrs (58%) [3.1%] |
12, 2024 |
0, 2009 |
| Cloud Cover |
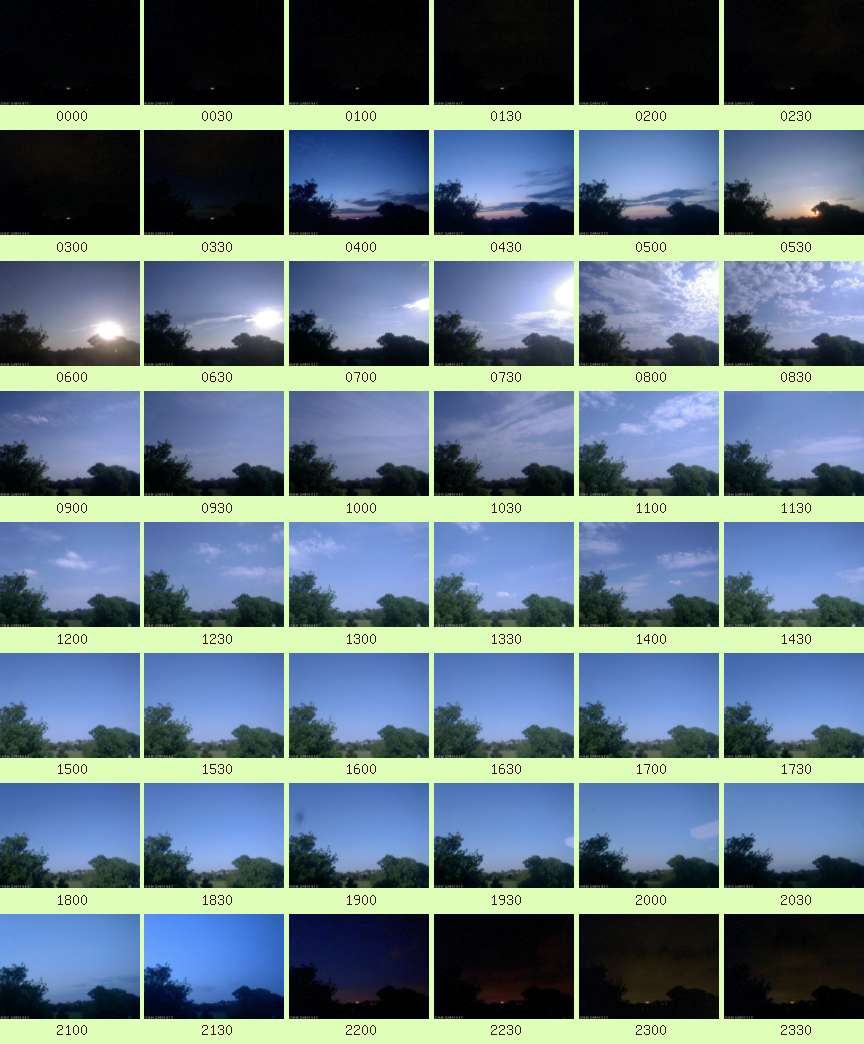
am: Mostly Sunny
pm: Sunny |
| Events |
Maximum possible sunshine |
| Comments |
- |
| Extra Comments |
|
| Issues |
None known |
| Observer Absent? |
Yes - observations may be unreliable |
| Pond Temperature @ Hampstead Heath |
0.0 °C |


 Large resolution version
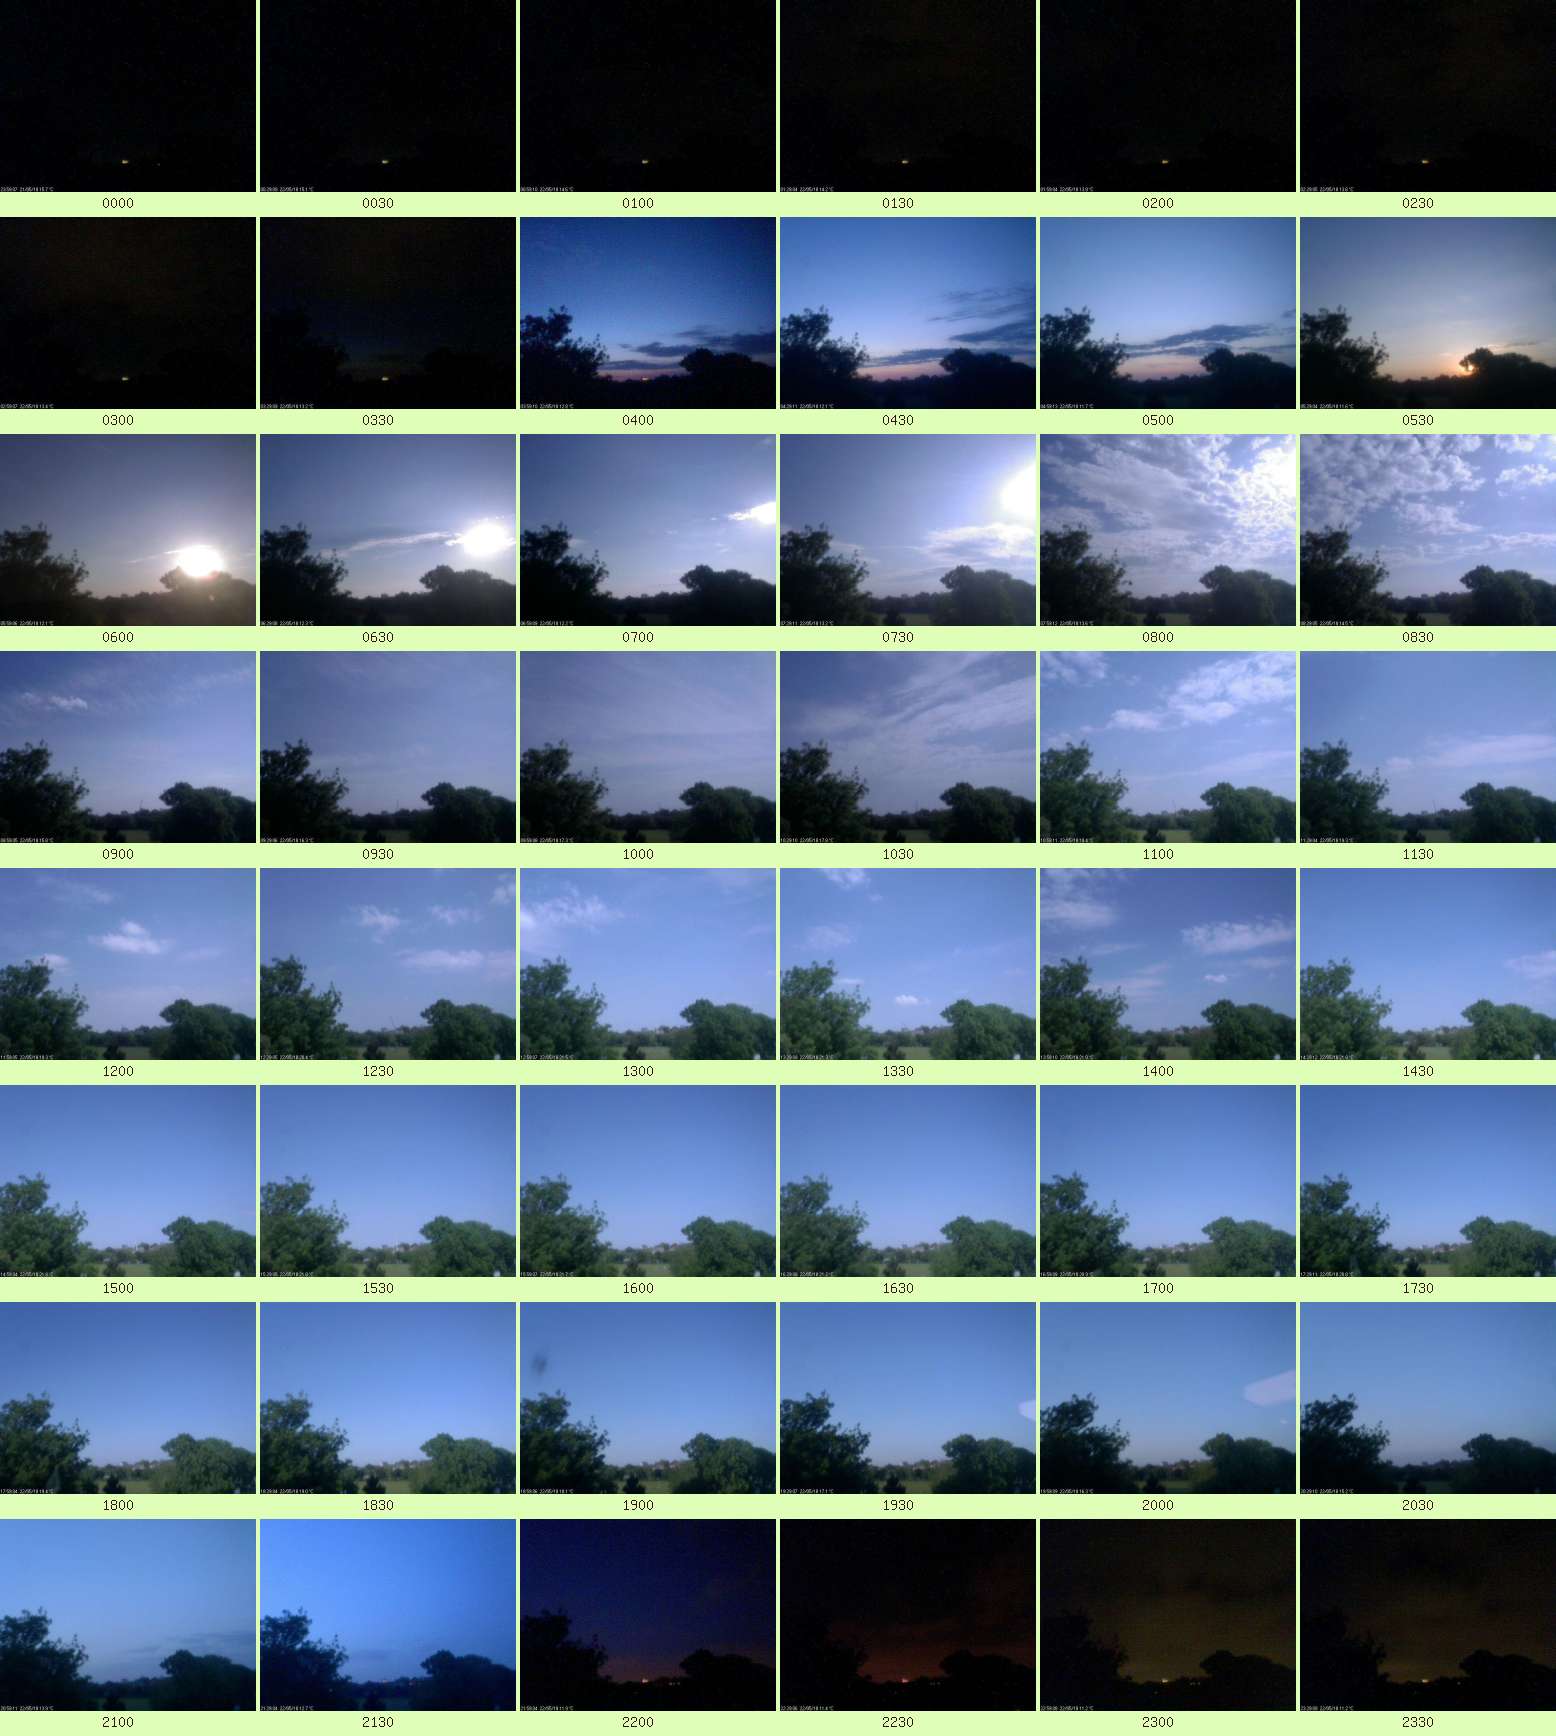