| Measure | Value (anomaly) | Time |
Month cumul. | Record High | Record Low |
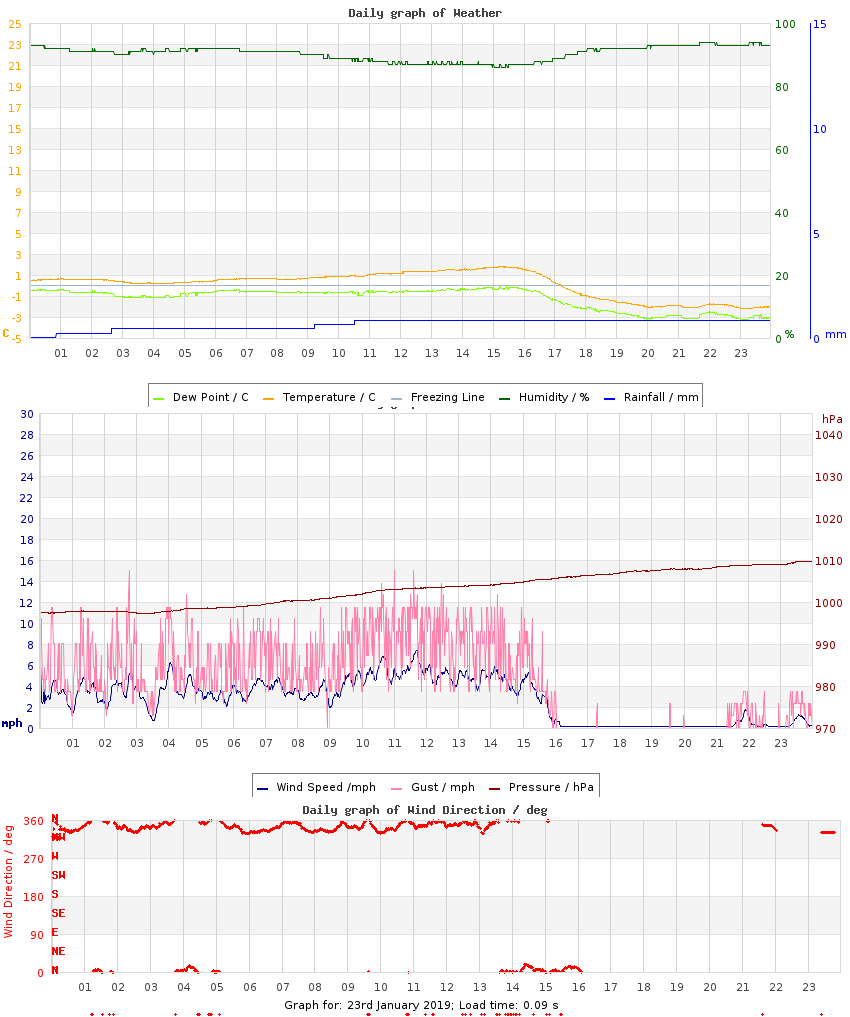
| Minimum Temperature |
-2.2 °C (-5.1) |
23:11 |
2.6 °C (-0.4) |
8.2 °C (+5.3), 2018 |
-4.9 °C (-7.8), 2023 |
| Maximum Temperature |
1.8 °C (-6.0) |
15:15 |
7.0 °C (-0.8) |
13.2 °C (+5.4), 2024 |
1.8 °C (-6.0), 2019 |
| Mean Temperature |
0.1 °C (-5.5) |
|
5.0 °C (-0.6) |
10.6 °C, 2018 |
0.1 °C, 2019 |
| Minimum Humidity |
86% |
15:07 |
74% |
88%, 2010 |
49%, 2009 |
| Maximum Humidity |
94% |
21:56 |
89% |
98%, 2010 |
83%, 2012 |
| Mean Humidity |
90% |
|
83% |
95%, 2010 |
71%, 2009 |
| Minimum Pressure |
997 hPa |
03:03 |
1021 hPa |
1037 hPa, 2023 |
967 hPa, 2009 |
| Maximum Pressure |
1010 hPa |
23:58 |
1028 hPa |
1040 hPa, 2023 |
985 hPa, 2009 |
| Mean Pressure |
1003 hPa |
|
1024 hPa |
1039 hPa, 2023 |
976 hPa, 2009 |
| Mean Wind Speed |
2.7 mph (-2.5) |
|
4.2 mph (-1.0) |
9.6 mph, 2024 |
0.2 mph, 2017 |
| Maximum Wind Speed |
9.3 mph |
10:38 |
11.9 mph |
29.6 mph, 2024 |
3.7 mph, 2017 |
| Maximum Gust |
15.0 mph |
02:46 |
18.4 mph |
38.0 mph, 2024 |
4.2 mph, 2017 |
| Mean Wind Direction |
N |
|
|
|
|
| Rainfall |
0.0 mm |
|
12.6 mm (29%) |
11.0 mm, 2009 |
|
| Maximum Hourly Rain |
n/a |
|
|
6.4, 2025 |
|
| Maximum 10-min Rain |
n/a |
|
|
2.6, 2025 |
|
| Maximum Rain Rate |
n/a |
|
|
36, 2025 |
|
| Minimum Dew Point |
-3.2 °C |
23:08 |
0.1 °C |
5.0 °C, 2018 |
-5.9 °C, 2023 |
| Maximum Dew Point |
-0.1 °C |
15:13 |
4.2 °C |
11.8 °C, 2024 |
-0.5 °C, 2013 |
| Mean Dew Point |
-1.2 °C |
|
2.3 °C |
8.5 °C, 2018 |
-1.6 °C, 2023 |
| Measure | Value | Time |
Month cumul. | Record High | Record Low |
| Night Minimum (21-09) |
* 0.2 °C * |
03:56 |
3.4 °C |
7.7 °C, 2018 |
-4.9 °C, 2023 |
| Day Maximum (09-21) |
1.8 °C |
15:18 |
6.8 °C |
12.7 °C, 2018 |
1.8 °C, 2019 |
| Max 10m Temp Rise |
0.2 °C |
20:38 |
0.3 °C |
0.9 °C, 2023 |
0.1 °C, 2010 |
| Max 1hr Temp Rise |
0.4 °C |
15:10 |
1.1 °C |
3.1 °C, 2023 |
0.1 °C, 2010 |
| Max 1hr Hum Rise |
3% |
17:34 |
4% |
7%, 2018 |
2%, 2010 |
| Max 10m Temp Fall |
0.4 °C |
16:54 |
0.4 °C |
0.6 °C, 2025 |
0.1 °C, 2011 |
| Max 1hr Temp Fall |
1.7 °C |
17:34 |
1.2 °C |
1.7 °C, 2019 |
0.3 °C, 2020 |
| Max 1hr Hum Fall |
2% |
01:17 |
6% |
21%, 2014 |
2%, 2017 |
| Max 10m Wind Speed |
7.4 mph |
11:41 |
8.7 mph |
18.5 mph, 2024 |
2.2 mph, 2017 |
| Minimum Feels-like |
-5.3 °C |
02:46 |
-0.7 °C |
4.9 °C, 2018 |
-6.2 °C, 2015 |
| Maximum Feels-like |
1.7 °C |
14:49 |
6.7 °C |
15.4 °C, 2024 |
1.7 °C, 2019 |
| Mean Feels-like |
-2.0 °C |
|
3.1 °C |
10.2 °C, 2018 |
-2.3 °C, 2013 |
| Air-frost Hrs |
7 hrs |
|
1 hrs |
11 hrs, 2015 |
0 hrs, 2010 |
| Measure | Value (anomaly) |
Month cumul. | Record High | Record Low |
| Temperature Range |
4.0 °C (-0.8) |
4.4 °C (-0.4) |
11.4 °C (+6.6), 2015 |
1.4 °C (-3.4), 2013 |
| Humidity Range |
8% |
15% |
44%, 2009 |
5%, 2017 |
| Pressure Range |
13 hPa |
8 hPa |
18 hPa, 2009 |
2 hPa, 2011 |
| Measure | Value [% of max] |
Month cumul. | Record High | Record Low |
| Sun Hours |
1.2 [15%] | 45 hrs (88%) [26%] |
6 [77%], 2015 |
0 [0%], 2011 |
| Wet Hours |
0 | 13 hrs (27%) [2.4%] |
3, 2024 |
, 2009 |
| Cloud Cover |
Partly Cloudy with periods of Mostly Cloudy |
| Events |
Lying Snow (at 09z): ~1 cm |
| Comments |
snow patches persisted |
| Extra Comments |
|
| Issues |
snow melt reassigned |
| Observer Absent? |
Yes - observations may be unreliable |
| Pond Temperature @ Hampstead Heath |
n/a |


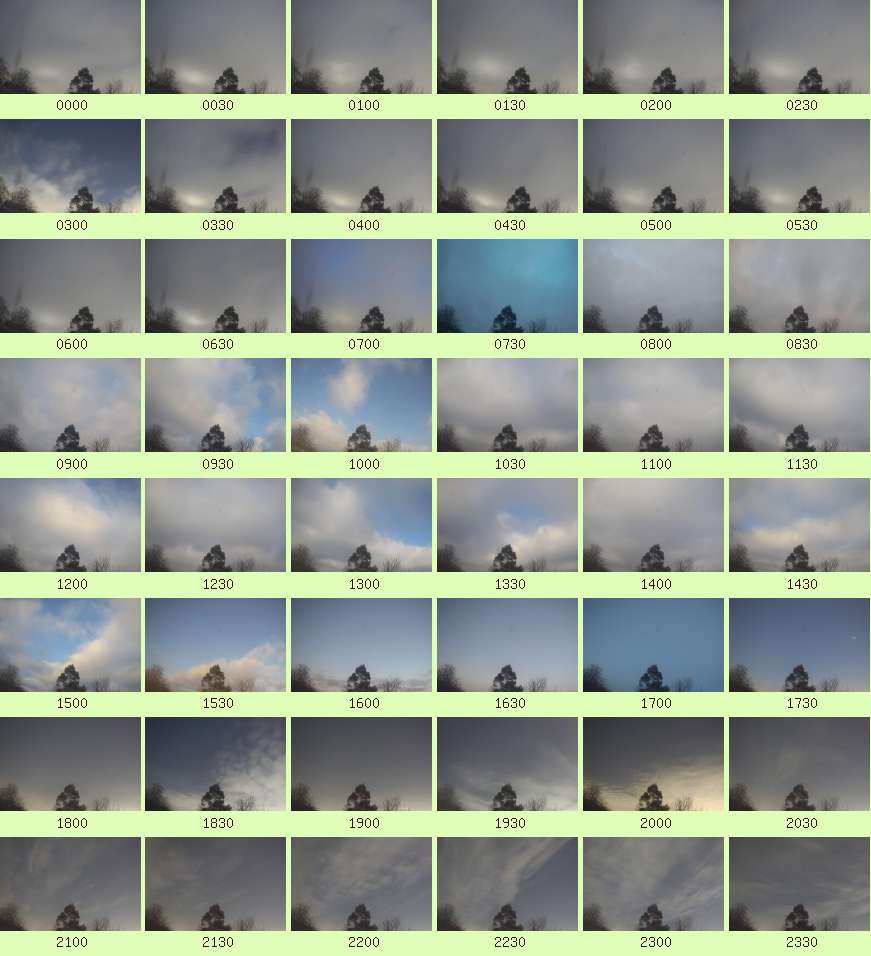 Full resolution individual images at up-to 5 minute intervals