| Measure | Value (anomaly) | Time |
Month cumul. | Record High | Record Low |
| Minimum Temperature |
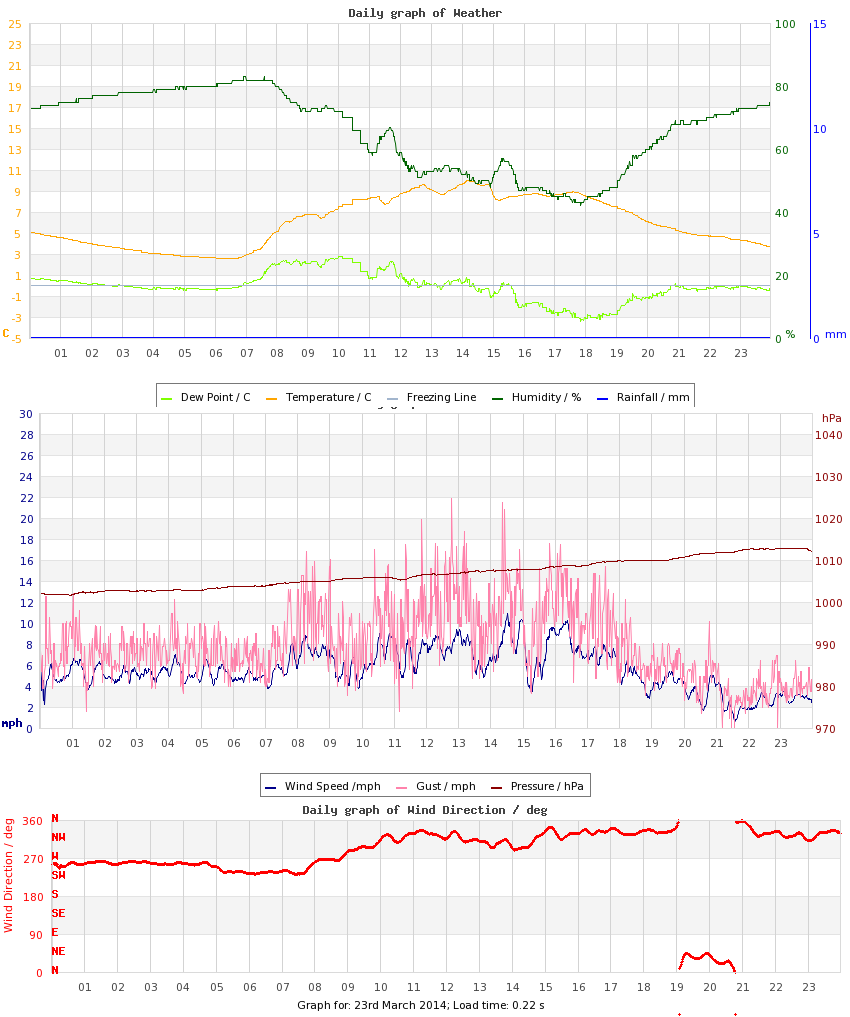
2.6 °C (-2.2) |
06:23 |
5.1 °C (+1.0) |
9.2 °C (+4.4), 2023 |
0.4 °C (-4.4), 2013 |
| Maximum Temperature |
10.0 °C (-1.7) |
14:11 |
13.5 °C (+2.9) |
19.5 °C (+7.8), 2012 |
2.6 °C (-9.1), 2013 |
| Mean Temperature |
6.1 °C (-1.9) |
|
9.1 °C (+1.9) |
12.5 °C, 2012 |
0.9 °C, 2013 |
| Minimum Humidity |
42% |
17:50 |
50% |
89%, 2013 |
36%, 2022 |
| Maximum Humidity |
83% |
07:15 |
88% |
98%, 2010 |
76%, 2020 |
| Mean Humidity |
66% |
|
71% |
96%, 2013 |
64%, 2020 |
| Minimum Pressure |
1002 hPa |
00:09 |
1013 hPa |
1038 hPa, 2011 |
995 hPa, 2023 |
| Maximum Pressure |
1013 hPa |
22:40 |
1020 hPa |
1042 hPa, 2011 |
1000 hPa, 2023 |
| Mean Pressure |
1007 hPa |
|
1016 hPa |
1040 hPa, 2011 |
998 hPa, 2023 |
| Mean Wind Speed |
5.6 mph (+0.4) |
|
5.1 mph (-0.1) |
10.5 mph, 2023 |
0.8 mph, 2022 |
| Maximum Wind Speed |
15.2 mph |
14:22 |
13.5 mph |
23.2 mph, 2023 |
5.8 mph, 2016 |
| Maximum Gust |
21.9 mph |
12:47 |
19.0 mph |
34.6 mph, 2023 |
8.7 mph, 2012 |
| Mean Wind Direction |
WNW |
|
|
|
|
| Rainfall |
trace |
|
19.0 mm (66%) |
6.8, 2013 |
|
| Maximum Hourly Rain |
n/a |
|
|
1.4, 2010 |
|
| Maximum 10-min Rain |
n/a |
|
|
0.5, 2009 |
|
| Maximum Rain Rate |
n/a |
|
|
3, 2017 |
|
| Minimum Dew Point |
-3.4 °C |
17:50 |
1.0 °C |
6.5 °C, 2023 |
-3.4 °C, 2014 |
| Maximum Dew Point |
2.8 °C |
10:03 |
6.8 °C |
10.1 °C, 2025 |
1.1 °C, 2013 |
| Mean Dew Point |
-0.1 °C |
|
3.8 °C |
8.3 °C, 2025 |
-0.1 °C, 2014 |
| Measure | Value | Time |
Month cumul. | Record High | Record Low |
| Night Minimum (21-09) |
2.6 °C |
06:23 |
5.2 °C |
9.2 °C, 2023 |
0.4 °C, 2013 |
| Day Maximum (09-21) |
10.0 °C |
14:11 |
13.5 °C |
19.5 °C, 2012 |
0.9 °C, 2013 |
| Max 10m Temp Rise |
0.7 °C |
07:42 |
0.6 °C |
0.8 °C, 2009 |
0.1 °C, 2013 |
| Max 1hr Temp Rise |
2.8 °C |
08:14 |
2.5 °C |
3.8 °C, 2011 |
0.3 °C, 2013 |
| Max 1hr Hum Rise |
12% |
19:31 |
9% |
15%, 2015 |
3%, 2013 |
| Max 10m Temp Fall |
1.1 °C |
15:05 |
0.5 °C |
1.1 °C, 2014 |
0.2 °C, 2010 |
| Max 1hr Temp Fall |
1.9 °C |
15:10 |
1.6 °C |
2.8 °C, 2009 |
0.7 °C, 2013 |
| Max 1hr Hum Fall |
16% |
12:38 |
13% |
19%, 2018 |
1%, 2013 |
| Max 10m Wind Speed |
10.9 mph |
14:31 |
10.1 mph |
17.8 mph, 2023 |
3.9 mph, 2016 |
| Minimum Feels-like |
-1.3 °C |
05:32 |
2.6 °C |
5.4 °C, 2023 |
-6.1 °C, 2013 |
| Maximum Feels-like |
10.0 °C |
14:09 |
13.5 °C |
19.5 °C, 2012 |
1.0 °C, 2013 |
| Mean Feels-like |
3.7 °C |
|
8.1 °C |
12.5 °C, 2012 |
-3.4 °C, 2013 |
| Air-frost Hrs |
0 hrs |
|
0 hrs |
0 hrs, 2009 |
0 hrs, 2009 |
| Measure | Value (anomaly) |
Month cumul. | Record High | Record Low |
| Temperature Range |
7.4 °C (+0.5) |
8.4 °C (+1.9) |
13.9 °C (+7.0), 2012 |
2.2 °C (-4.7), 2013 |
| Humidity Range |
41% |
38% |
56%, 2012 |
9%, 2013 |
| Pressure Range |
11 hPa |
8 hPa |
17 hPa, 2009 |
2 hPa, 2012 |
| Measure | Value [% of max] |
Month cumul. | Record High | Record Low |
| Sun Hours |
6 [54%] | 127 hrs (155%) [53%] |
11.2 [101%], 2020 |
0 [0%], 2013 |
| Wet Hours |
0.2 | 17 hrs (43%) [3.1%] |
18, 2013 |
, 2009 |
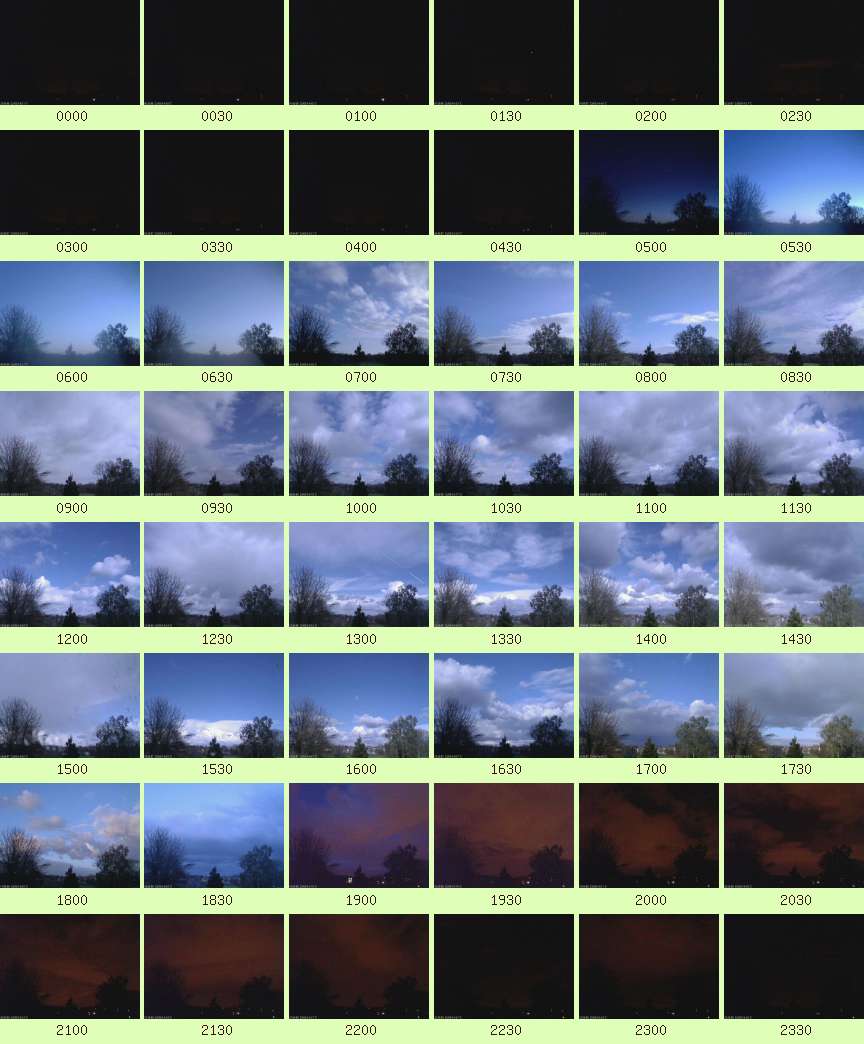
| Cloud Cover |
Partly Cloudy with periods of Mostly Sunny |
| Events |
None |
| Comments |
11, 15 brief Moderate Showers |
| Extra Comments |
|
| Issues |
None known |
| Observer Absent? |
No |
| Pond Temperature @ Hampstead Heath |
0.0 °C |


 Large resolution version