| Measure | Value (anomaly) | Time |
Month cumul. | Record High | Record Low |
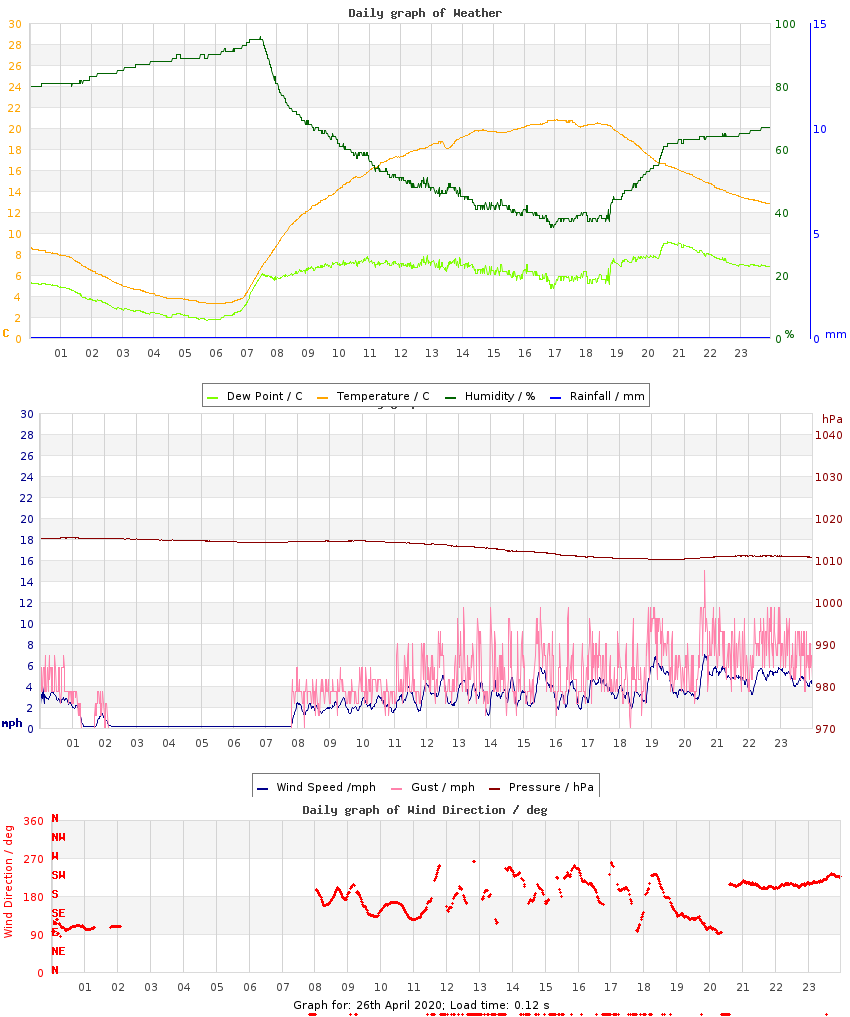
| Minimum Temperature |
3.3 °C (-3.4) |
06:00 |
6.2 °C (+0.2) |
9.3 °C (+2.6), 2012 |
2.1 °C (-4.6), 2016 |
| Maximum Temperature |
20.8 °C (+5.2) |
17:04 |
18.0 °C (+3.6) |
20.8 °C (+5.2), 2020 |
9.5 °C (-6.1), 2016 |
| Mean Temperature |
13.1 °C (+0.9) |
|
12.1 °C (+1.9) |
13.1 °C, 2020 |
5.3 °C, 2017 |
| Minimum Humidity |
35% |
16:52 |
44% |
65%, 2015 |
32%, 2009 |
| Maximum Humidity |
96% |
07:27 |
85% |
96%, 2014 |
78%, 2017 |
| Mean Humidity |
64% |
|
65% |
82%, 2015 |
59%, 2009 |
| Minimum Pressure |
1010 hPa |
19:30 |
1018 hPa |
1024 hPa, 2011 |
984 hPa, 2012 |
| Maximum Pressure |
1016 hPa |
00:55 |
1024 hPa |
1028 hPa, 2021 |
1003 hPa, 2012 |
| Mean Pressure |
1013 hPa |
|
1021 hPa |
1025 hPa, 2010 |
994 hPa, 2012 |
| Mean Wind Speed |
2.5 mph (-2.4) |
|
4.6 mph (-0.3) |
10.7 mph, 2012 |
2.5 mph, 2020 |
| Maximum Wind Speed |
8.6 mph |
20:37 |
12.9 mph |
25.1 mph, 2012 |
8.6 mph, 2020 |
| Maximum Gust |
15.0 mph |
20:38 |
19.2 mph |
33.4 mph, 2012 |
13.5 mph, 2015 |
| Mean Wind Direction |
S |
|
|
|
|
| Rainfall |
0.0 mm |
|
2.8 mm (8%) |
3.9 mm, 2013 |
|
| Maximum Hourly Rain |
n/a |
|
|
2.6, 2015 |
|
| Maximum 10-min Rain |
n/a |
|
|
0.8, 2012 |
|
| Maximum Rain Rate |
n/a |
|
|
24, 2017 |
|
| Minimum Dew Point |
1.7 °C |
05:43 |
2.7 °C |
6.4 °C, 2010 |
-4.8 °C, 2016 |
| Maximum Dew Point |
9.2 °C |
20:39 |
7.9 °C |
11.7 °C, 2010 |
1.5 °C, 2016 |
| Mean Dew Point |
5.7 °C |
|
5.2 °C |
8.2 °C, 2010 |
-1.7 °C, 2016 |
| Measure | Value | Time |
Month cumul. | Record High | Record Low |
| Night Minimum (21-09) |
3.3 °C |
06:01 |
6.4 °C |
9.3 °C, 2012 |
2.1 °C, 2016 |
| Day Maximum (09-21) |
20.8 °C |
17:02 |
17.9 °C |
20.8 °C, 2020 |
9.5 °C, 2016 |
| Max 10m Temp Rise |
0.9 °C |
07:12 |
0.7 °C |
0.9 °C, 2017 |
0.3 °C, 2015 |
| Max 1hr Temp Rise |
4.7 °C |
08:05 |
2.9 °C |
4.7 °C, 2020 |
1.1 °C, 2015 |
| Max 1hr Hum Rise |
13% |
19:46 |
10% |
26%, 2018 |
5%, 2011 |
| Max 10m Temp Fall |
0.6 °C |
19:54 |
0.6 °C |
1.4 °C, 2017 |
0.3 °C, 2023 |
| Max 1hr Temp Fall |
2.4 °C |
20:13 |
2.1 °C |
2.8 °C, 2019 |
0.8 °C, 2023 |
| Max 1hr Hum Fall |
23% |
08:27 |
12% |
28%, 2018 |
7%, 2017 |
| Max 10m Wind Speed |
7.0 mph |
20:38 |
9.6 mph |
16.2 mph, 2012 |
6.1 mph, 2011 |
| Minimum Feels-like |
3.3 °C |
05:43 |
4.2 °C |
6.1 °C, 2010 |
-3.2 °C, 2016 |
| Maximum Feels-like |
20.8 °C |
17:00 |
18.3 °C |
20.8 °C, 2020 |
8.0 °C, 2016 |
| Mean Feels-like |
13.1 °C |
|
11.7 °C |
13.1 °C, 2020 |
2.3 °C, 2016 |
| Air-frost Hrs |
0 hrs |
|
0.2 hrs |
0 hrs, 2009 |
0 hrs, 2009 |
| Measure | Value (anomaly) |
Month cumul. | Record High | Record Low |
| Temperature Range |
17.5 °C (+8.6) |
11.8 °C (+3.5) |
17.5 °C (+8.6), 2020 |
5.1 °C (-3.8), 2012 |
| Humidity Range |
61% |
42% |
61%, 2020 |
19%, 2011 |
| Pressure Range |
5 hPa |
6 hPa |
19 hPa, 2012 |
2 hPa, 2011 |
| Measure | Value [% of max] |
Month cumul. | Record High | Record Low |
| Sun Hours |
13 [99%] | 230 hrs (166%) [71%] |
13 [99%], 2020 |
0 [0%], 2015 |
| Wet Hours |
0 | 3.5 hrs (9%) [0.6%] |
3.5, 2013 |
0, 2009 |
| Cloud Cover |
am: Sunny
pm: Sunny transitioned to Mostly Sunny |
| Events |
Maximum possible sunshine |
| Comments |
- |
| Extra Comments |
|
| Issues |
None known |
| Observer Absent? |
Yes - observations may be unreliable |
| Pond Temperature @ Hampstead Heath |
5.0 °C |


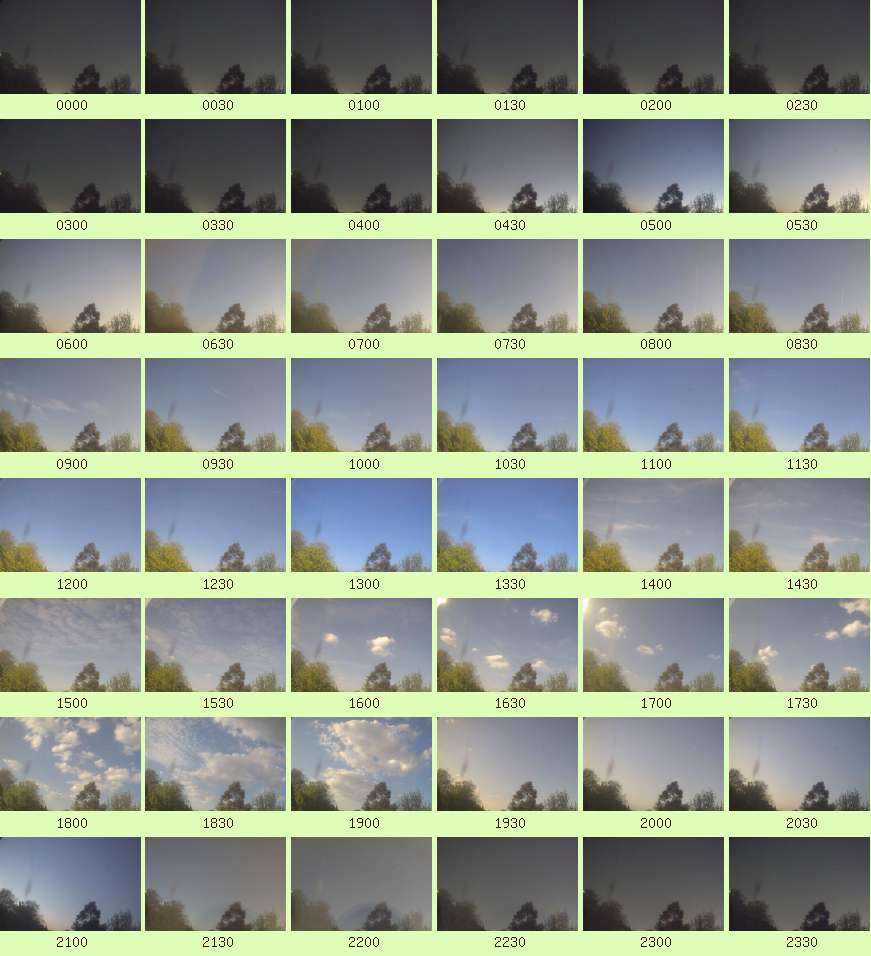 Full resolution individual images at up-to 5 minute intervals