| Measure | Value (anomaly) | Time |
Month cumul. | Record High | Record Low |
| Minimum Temperature |
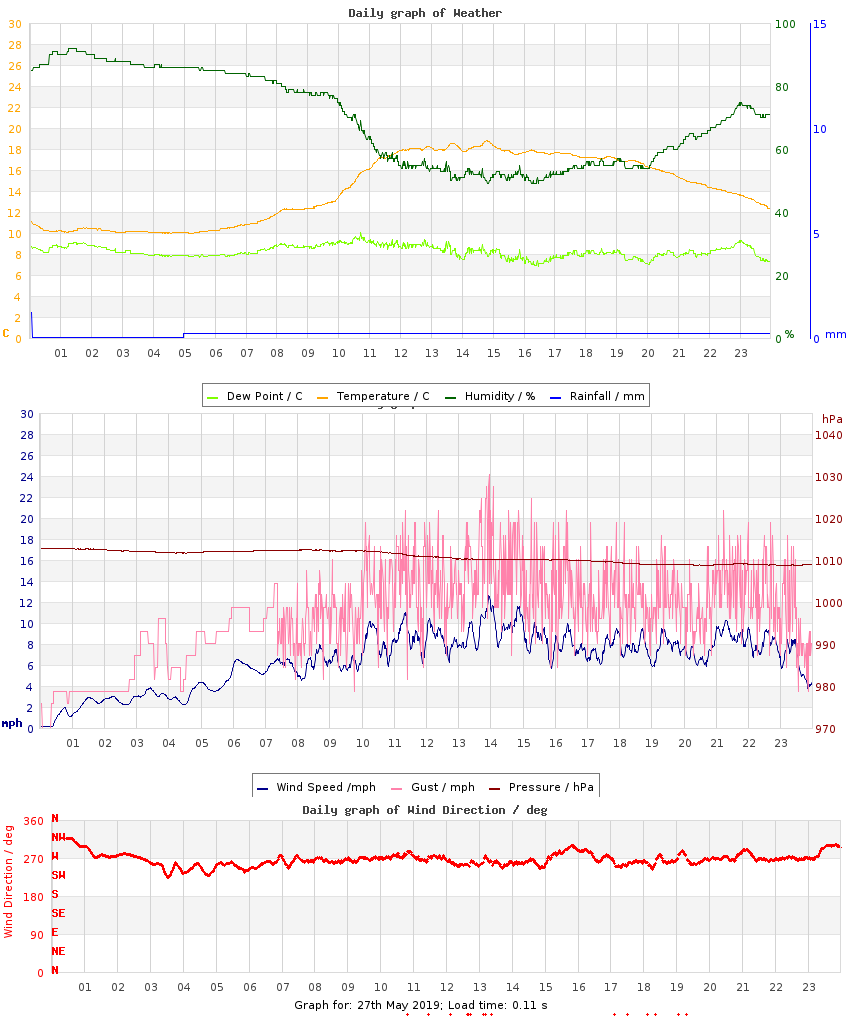
10.0 °C (-0.4) |
05:13 |
7.6 °C (-1.3) |
15.1 °C (+4.7), 2017 |
7.5 °C (-2.9), 2015 |
| Maximum Temperature |
18.8 °C (-0.1) |
14:47 |
17.4 °C (-0.2) |
27.1 °C (+8.2), 2018 |
13.2 °C (-5.8), 2014 |
| Mean Temperature |
14.2 °C (-0.3) |
|
12.6 °C (-0.7) |
20.7 °C, 2018 |
11.5 °C, 2009 |
| Minimum Humidity |
49% |
16:19 |
49% |
89%, 2014 |
29%, 2012 |
| Maximum Humidity |
92% |
01:22 |
89% |
97%, 2014 |
65%, 2013 |
| Mean Humidity |
69% |
|
70% |
94%, 2014 |
47%, 2013 |
| Minimum Pressure |
1009 hPa |
23:30 |
1014 hPa |
1035 hPa, 2020 |
1004 hPa, 2013 |
| Maximum Pressure |
1013 hPa |
00:18 |
1021 hPa |
1037 hPa, 2020 |
1011 hPa, 2010 |
| Mean Pressure |
1011 hPa |
|
1017 hPa |
1036 hPa, 2020 |
1009 hPa, 2013 |
| Mean Wind Speed |
6.5 mph (+1.8) |
|
3.4 mph (-1.3) |
8.7 mph, 2025 |
1.6 mph, 2021 |
| Maximum Wind Speed |
16.1 mph |
13:50 |
11.9 mph |
19.2 mph, 2013 |
7.9 mph, 2021 |
| Maximum Gust |
24.2 mph |
13:57 |
18.6 mph |
30.0 mph, 2025 |
11.4 mph, 2021 |
| Mean Wind Direction |
W |
|
|
|
|
| Rainfall |
0.0 mm |
|
30.7 mm (77%) |
9.0 mm, 2025 |
|
| Maximum Hourly Rain |
n/a |
|
|
3.4, 2025 |
|
| Maximum 10-min Rain |
n/a |
|
|
1.8, 2018 |
|
| Maximum Rain Rate |
n/a |
|
|
40, 2018 |
|
| Minimum Dew Point |
6.8 °C |
16:28 |
3.9 °C |
12.8 °C, 2018 |
0.4 °C, 2013 |
| Maximum Dew Point |
10.1 °C |
10:43 |
9.3 °C |
19.4 °C, 2018 |
5.3 °C, 2013 |
| Mean Dew Point |
8.3 °C |
|
6.9 °C |
16.1 °C, 2018 |
2.3 °C, 2013 |
| Measure | Value | Time |
Month cumul. | Record High | Record Low |
| Night Minimum (21-09) |
10.0 °C |
04:47 |
7.8 °C |
15.1 °C, 2017 |
7.5 °C, 2015 |
| Day Maximum (09-21) |
18.8 °C |
14:48 |
17.4 °C |
27.1 °C, 2018 |
13.2 °C, 2014 |
| Max 10m Temp Rise |
0.9 °C |
10:39 |
0.7 °C |
0.9 °C, 2019 |
0.2 °C, 2014 |
| Max 1hr Temp Rise |
3.1 °C |
10:53 |
2.5 °C |
3.3 °C, 2018 |
0.6 °C, 2014 |
| Max 1hr Hum Rise |
9% |
22:54 |
13% |
15%, 2018 |
2%, 2014 |
| Max 10m Temp Fall |
0.6 °C |
14:00 |
0.7 °C |
1.1 °C, 2017 |
0.2 °C, 2009 |
| Max 1hr Temp Fall |
1.3 °C |
15:47 |
2.1 °C |
2.7 °C, 2017 |
0.8 °C, 2009 |
| Max 1hr Hum Fall |
13% |
10:53 |
13% |
15%, 2010 |
4%, 2009 |
| Max 10m Wind Speed |
12.7 mph |
13:56 |
8.5 mph |
13.5 mph, 2017 |
5.2 mph, 2021 |
| Minimum Feels-like |
10.3 °C |
04:17 |
6.3 °C |
16.9 °C, 2017 |
5.3 °C, 2013 |
| Maximum Feels-like |
19.3 °C |
13:37 |
18.2 °C |
33.7 °C, 2018 |
15.4 °C, 2014 |
| Mean Feels-like |
14.7 °C |
|
12.9 °C |
25.4 °C, 2018 |
12.3 °C, 2010 |
| Air-frost Hrs |
0 hrs |
|
0 hrs |
0 hrs, 2009 |
0 hrs, 2009 |
| Measure | Value (anomaly) |
Month cumul. | Record High | Record Low |
| Temperature Range |
8.8 °C (+0.3) |
9.9 °C (+1.1) |
13.2 °C (+4.7), 2012 |
2.9 °C (-5.6), 2025 |
| Humidity Range |
43% |
40% |
46%, 2010 |
8%, 2014 |
| Pressure Range |
4 hPa |
7 hPa |
12 hPa, 2015 |
2 hPa, 2010 |
| Measure | Value [% of max] |
Month cumul. | Record High | Record Low |
| Sun Hours |
3.4 [23%] | 166 hrs (101%) [44%] |
14.7 [101%], 2012 |
0 [0%], 2009 |
| Wet Hours |
0 | 27 hrs (76%) [4.1%] |
10, 2014 |
0, 2011 |
| Cloud Cover |
Mostly Cloudy with periods of Partly Cloudy |
| Events |
None |
| Comments |
- |
| Extra Comments |
|
| Issues |
server CPU pegged - some data issues -8 |
| Observer Absent? |
Yes - observations may be unreliable |
| Pond Temperature @ Hampstead Heath |
17.0 °C |


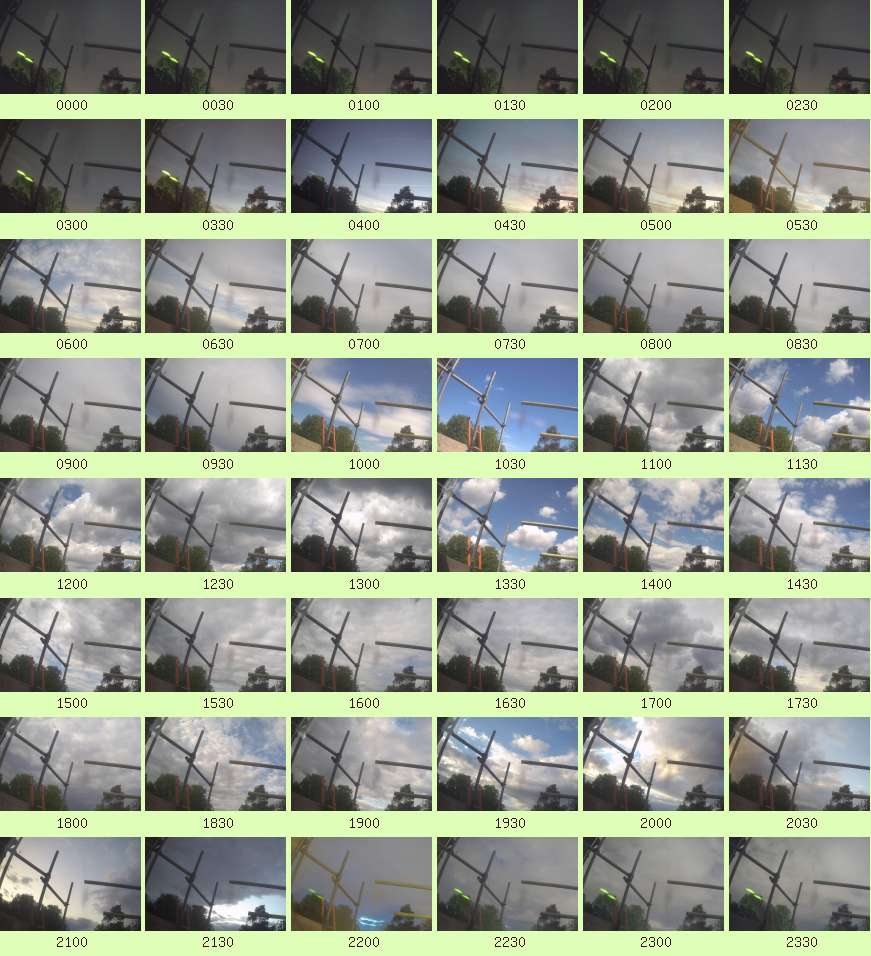 Full resolution individual images at up-to 5 minute intervals