| Measure | Value (anomaly) | Time |
Month cumul. | Record High | Record Low |
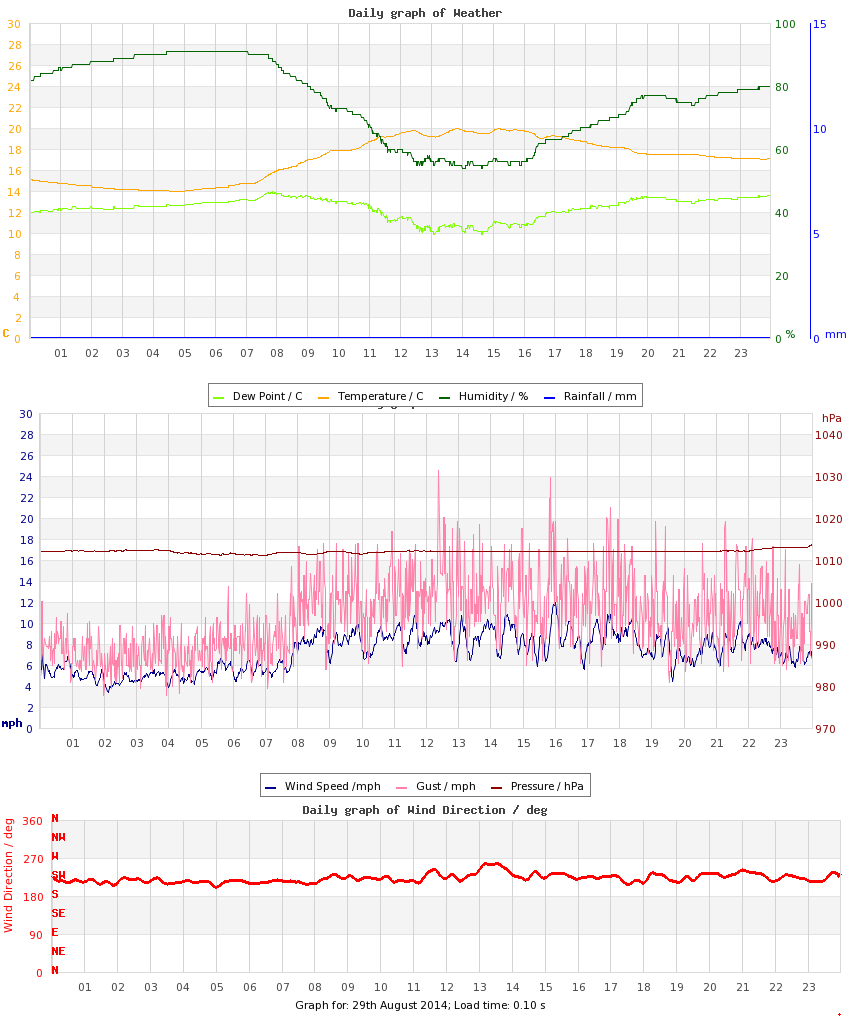
| Minimum Temperature |
14.0 °C (+0.8) |
04:46 |
12.9 °C (-1.2) |
16.7 °C (+3.5), 2017 |
9.1 °C (-4.1), 2009 |
| Maximum Temperature |
20.0 °C (-1.6) |
13:50 |
20.9 °C (-1.6) |
25.3 °C (+3.8), 2017 |
14.7 °C (-6.9), 2020 |
| Mean Temperature |
17.1 °C (-0.4) |
|
16.8 °C (-1.4) |
20.6 °C, 2017 |
12.6 °C, 2020 |
| Minimum Humidity |
54% |
14:19 |
46% |
73%, 2020 |
41%, 2009 |
| Maximum Humidity |
91% |
05:44 |
86% |
95%, 2018 |
80%, 2017 |
| Mean Humidity |
75% |
|
68% |
84%, 2020 |
63%, 2013 |
| Minimum Pressure |
1011 hPa |
07:00 |
1008 hPa |
1025 hPa, 2021 |
995 hPa, 2025 |
| Maximum Pressure |
1013 hPa |
12:02 |
1014 hPa |
1027 hPa, 2021 |
1003 hPa, 2025 |
| Mean Pressure |
1012 hPa |
|
1011 hPa |
1026 hPa, 2021 |
998 hPa, 2025 |
| Mean Wind Speed |
7.2 mph (+3.2) |
|
4.9 mph (+0.9) |
7.2 mph, 2014 |
1.8 mph, 2018 |
| Maximum Wind Speed |
16.6 mph |
12:57 |
12.9 mph |
18.7 mph, 2012 |
7.0 mph, 2017 |
| Maximum Gust |
24.6 mph |
12:22 |
18.7 mph |
26.5 mph, 2020 |
12.5 mph, 2015 |
| Mean Wind Direction |
SW |
|
|
|
|
| Rainfall |
0.0 mm |
|
116.6 mm (231%) |
19.2 mm, 2025 |
|
| Maximum Hourly Rain |
n/a |
|
|
7, 2025 |
|
| Maximum 10-min Rain |
n/a |
|
|
2, 2012 |
|
| Maximum Rain Rate |
n/a |
|
|
60, 2012 |
|
| Minimum Dew Point |
9.9 °C |
13:52 |
7.3 °C |
12.2 °C, 2017 |
3.0 °C, 2010 |
| Maximum Dew Point |
14.0 °C |
07:51 |
13.1 °C |
15.6 °C, 2016 |
10.0 °C, 2009 |
| Mean Dew Point |
12.4 °C |
|
10.3 °C |
13.5 °C, 2017 |
7.2 °C, 2009 |
| Measure | Value | Time |
Month cumul. | Record High | Record Low |
| Night Minimum (21-09) |
14.0 °C |
04:46 |
13.1 °C |
16.7 °C, 2017 |
9.1 °C, 2009 |
| Day Maximum (09-21) |
20.0 °C |
13:50 |
20.9 °C |
25.3 °C, 2017 |
14.7 °C, 2020 |
| Max 10m Temp Rise |
0.4 °C |
10:52 |
0.6 °C |
0.8 °C, 2013 |
0.3 °C, 2020 |
| Max 1hr Temp Rise |
1.5 °C |
08:13 |
2.2 °C |
3.0 °C, 2013 |
1.2 °C, 2020 |
| Max 1hr Hum Rise |
8% |
16:52 |
9% |
21%, 2010 |
5%, 2011 |
| Max 10m Temp Fall |
0.5 °C |
16:30 |
0.7 °C |
1.8 °C, 2012 |
0.3 °C, 2015 |
| Max 1hr Temp Fall |
0.8 °C |
16:30 |
1.9 °C |
4.2 °C, 2012 |
0.8 °C, 2014 |
| Max 1hr Hum Fall |
12% |
11:35 |
13% |
37%, 2010 |
5%, 2020 |
| Max 10m Wind Speed |
12.0 mph |
16:00 |
9.8 mph |
14.2 mph, 2012 |
5.2 mph, 2018 |
| Minimum Feels-like |
16.6 °C |
04:31 |
13.9 °C |
19.1 °C, 2017 |
7.6 °C, 2009 |
| Maximum Feels-like |
21.8 °C |
15:08 |
22.6 °C |
28.9 °C, 2017 |
16.1 °C, 2020 |
| Mean Feels-like |
19.5 °C |
|
18.4 °C |
23.7 °C, 2017 |
13.8 °C, 2020 |
| Air-frost Hrs |
0 hrs |
|
0 hrs |
0 hrs, 2009 |
0 hrs, 2009 |
| Measure | Value (anomaly) |
Month cumul. | Record High | Record Low |
| Temperature Range |
6.0 °C (-2.4) |
8.0 °C (-0.4) |
10.2 °C (+1.8), 2009 |
3.6 °C (-4.8), 2020 |
| Humidity Range |
37% |
40% |
52%, 2009 |
19%, 2020 |
| Pressure Range |
2 hPa |
6 hPa |
12 hPa, 2020 |
2 hPa, 2011 |
| Measure | Value [% of max] |
Month cumul. | Record High | Record Low |
| Sun Hours |
3 [24%] | 149 hrs (86%) [39%] |
10 [80%], 2013 |
0.3 [2%], 2018 |
| Wet Hours |
0.2 | 51 hrs (142%) [7.3%] |
8, 2025 |
0, 2009 |
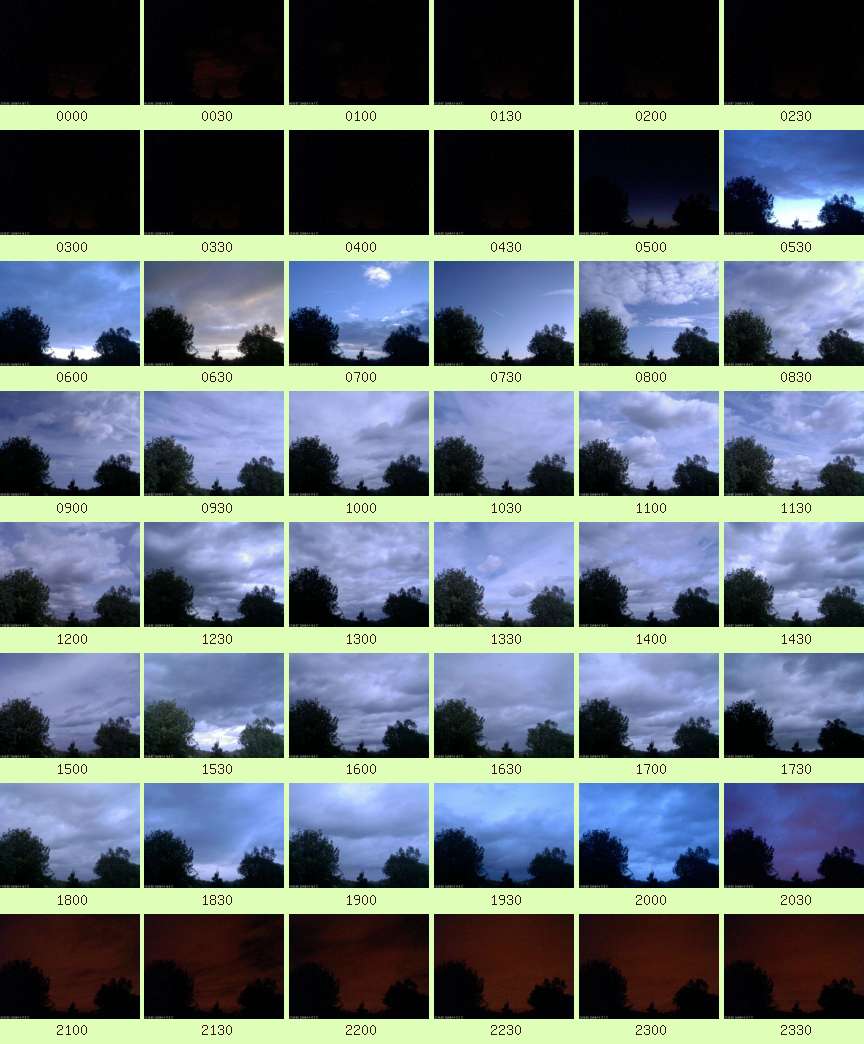
| Cloud Cover |
am: Partly Cloudy
pm: Mostly Cloudy |
| Events |
None |
| Comments |
16, 19 brief Slight Showers |
| Extra Comments |
|
| Issues |
None known |
| Observer Absent? |
No |
| Pond Temperature @ Hampstead Heath |
0.0 °C |


 Large resolution version