| Measure | Value (anomaly) | Time |
Month cumul. | Record High | Record Low |
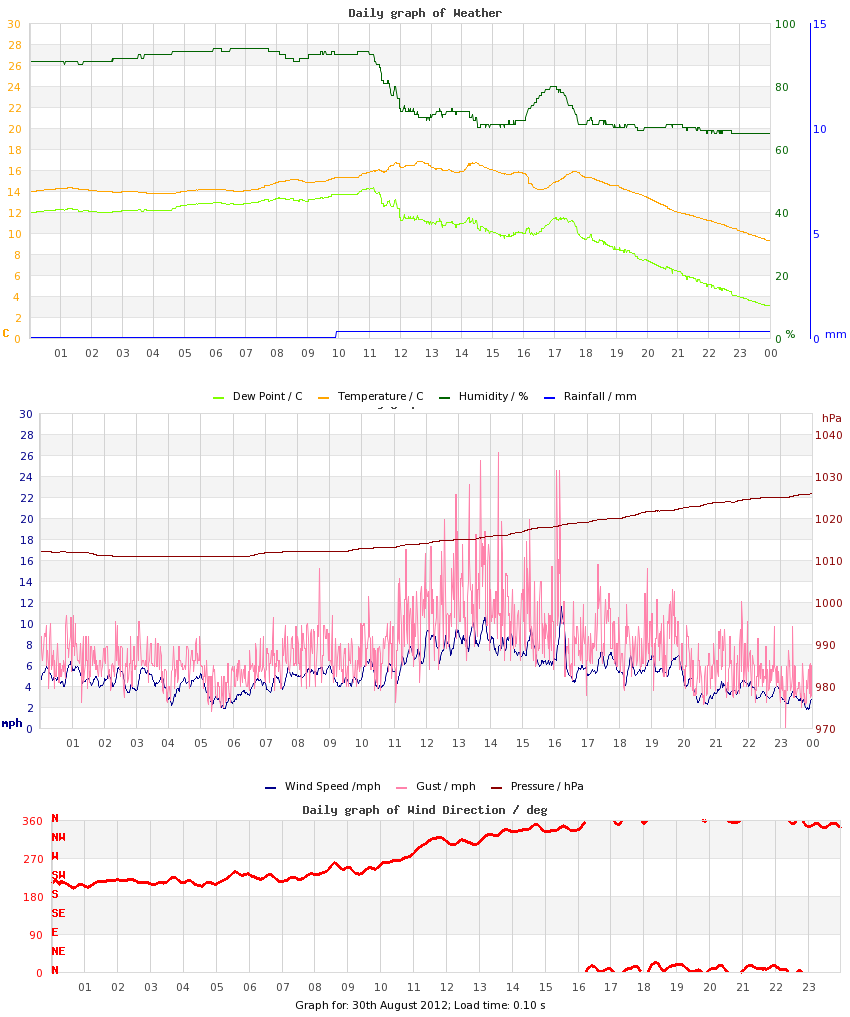
| Minimum Temperature |
9.3 °C (-3.7) |
23:59 |
14.9 °C (+0.9) |
15.5 °C (+2.5), 2013 |
9.3 °C (-3.7), 2010 |
| Maximum Temperature |
16.8 °C (-4.6) |
12:37 |
23.0 °C (+0.6) |
25.8 °C (+4.4), 2016 |
16.1 °C (-5.3), 2020 |
| Mean Temperature |
14.3 °C (-4.1) |
|
18.7 °C (+0.8) |
19.7 °C, 2013 |
13.2 °C, 2017 |
| Minimum Humidity |
65% |
23:59 |
47% |
76%, 2021 |
34%, 2016 |
| Maximum Humidity |
92% |
06:48 |
88% |
92%, 2012 |
76%, 2011 |
| Mean Humidity |
79% |
|
69% |
84%, 2015 |
60%, 2016 |
| Minimum Pressure |
1011 hPa |
03:33 |
1011 hPa |
1026 hPa, 2021 |
1002 hPa, 2025 |
| Maximum Pressure |
1026 hPa |
23:37 |
1017 hPa |
1029 hPa, 2021 |
1006 hPa, 2025 |
| Mean Pressure |
1016 hPa |
|
1014 hPa |
1027 hPa, 2021 |
1004 hPa, 2025 |
| Mean Wind Speed |
5.2 mph (+1.2) |
|
4.7 mph (+0.7) |
6.9 mph, 2025 |
1.3 mph, 2024 |
| Maximum Wind Speed |
16.8 mph |
13:20 |
12.4 mph |
17.7 mph, 2025 |
7.0 mph, 2018 |
| Maximum Gust |
26.3 mph |
14:13 |
17.3 mph |
26.5 mph, 2025 |
10.4 mph, 2018 |
| Mean Wind Direction |
WNW |
|
|
|
|
| Rainfall |
0.3 mm |
|
31.7 mm (61%) |
9.1 mm, 2017 |
|
| Maximum Hourly Rain |
n/a |
|
|
3.8, 2017 |
|
| Maximum 10-min Rain |
n/a |
|
|
1.3, 2017 |
|
| Maximum Rain Rate |
n/a |
|
|
24, 2014 |
|
| Minimum Dew Point |
3.1 °C |
23:53 |
9.8 °C |
13.5 °C, 2015 |
3.1 °C, 2012 |
| Maximum Dew Point |
14.4 °C |
11:07 |
15.3 °C |
16.7 °C, 2025 |
9.8 °C, 2011 |
| Mean Dew Point |
10.6 °C |
|
12.6 °C |
14.4 °C, 2015 |
7.1 °C, 2010 |
| Measure | Value | Time |
Month cumul. | Record High | Record Low |
| Night Minimum (21-09) |
* 13.8 °C * |
04:15 |
15.1 °C |
15.5 °C, 2013 |
9.3 °C, 2010 |
| Day Maximum (09-21) |
16.8 °C |
12:38 |
23.0 °C |
25.8 °C, 2016 |
13.7 °C, 2017 |
| Max 10m Temp Rise |
0.7 °C |
14:12 |
0.7 °C |
0.8 °C, 2013 |
0.2 °C, 2017 |
| Max 1hr Temp Rise |
1.7 °C |
17:34 |
2.4 °C |
3.3 °C, 2022 |
0.5 °C, 2017 |
| Max 1hr Hum Rise |
11% |
16:41 |
10% |
13%, 2018 |
4%, 2015 |
| Max 10m Temp Fall |
0.9 °C |
16:13 |
0.6 °C |
0.9 °C, 2012 |
0.3 °C, 2009 |
| Max 1hr Temp Fall |
1.5 °C |
16:36 |
1.9 °C |
2.3 °C, 2013 |
0.8 °C, 2021 |
| Max 1hr Hum Fall |
18% |
11:58 |
12% |
18%, 2012 |
3%, 2021 |
| Max 10m Wind Speed |
11.6 mph |
16:12 |
9.3 mph |
13.2 mph, 2025 |
4.4 mph, 2018 |
| Minimum Feels-like |
7.7 °C |
23:23 |
17.1 °C |
18.2 °C, 2013 |
6.7 °C, 2010 |
| Maximum Feels-like |
19.6 °C |
11:49 |
25.7 °C |
27.3 °C, 2019 |
16.8 °C, 2011 |
| Mean Feels-like |
16.1 °C |
|
21.4 °C |
22.7 °C, 2013 |
14.3 °C, 2017 |
| Air-frost Hrs |
0 hrs |
|
0 hrs |
0 hrs, 2009 |
0 hrs, 2009 |
| Measure | Value (anomaly) |
Month cumul. | Record High | Record Low |
| Temperature Range |
7.5 °C (-0.9) |
8.2 °C (-0.3) |
14.0 °C (+5.6), 2016 |
3.0 °C (-5.4), 2021 |
| Humidity Range |
27% |
41% |
53%, 2016 |
13%, 2017 |
| Pressure Range |
15 hPa |
6 hPa |
15 hPa, 2012 |
2 hPa, 2011 |
| Measure | Value [% of max] |
Month cumul. | Record High | Record Low |
| Sun Hours |
1.5 [12%] | 153 hrs (86%) [39%] |
12.2 [98%], 2016 |
0 [0%], 2011 |
| Wet Hours |
1 | 17 hrs (45%) [2.3%] |
7, 2017 |
0, 2009 |
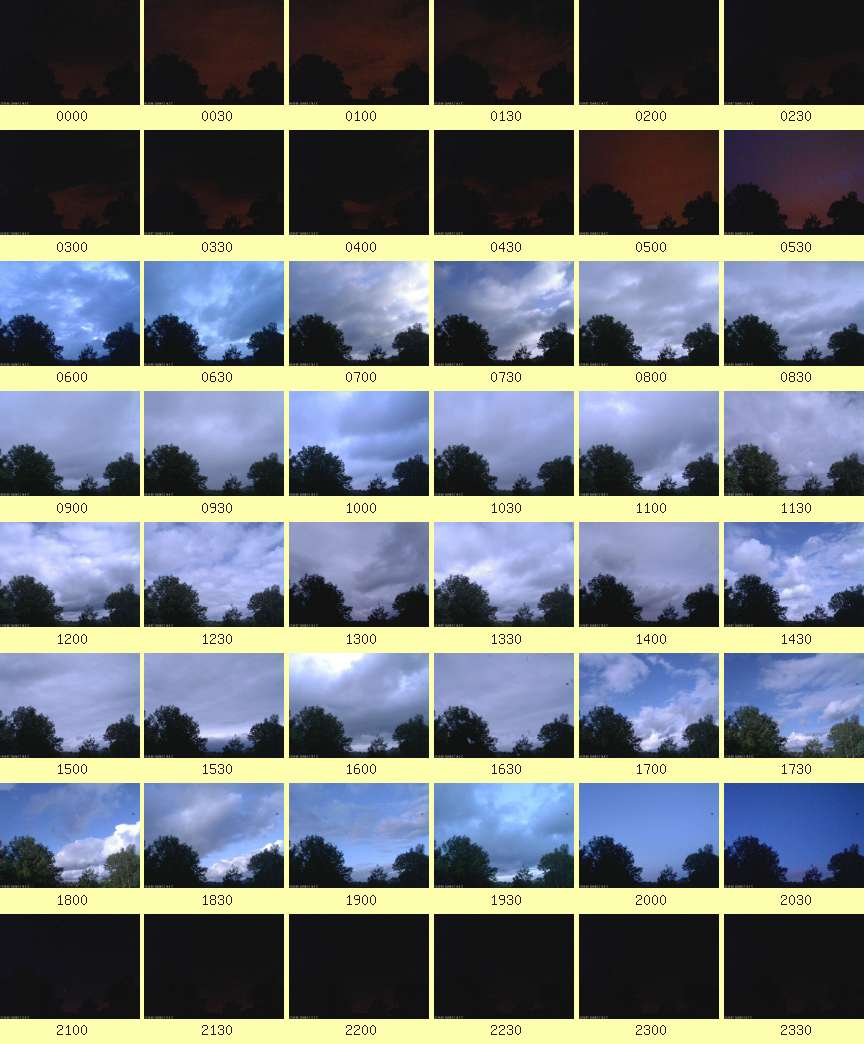
| Cloud Cover |
am: Overcast with periods of Mostly Cloudy
pm: Mostly Cloudy |
| Events |
None |
| Comments |
09, 10 Light Showers/Drizzle; 16 Moderate Shower |
| Extra Comments |
- |
| Issues |
None known |
| Observer Absent? |
No |
| Pond Temperature @ Hampstead Heath |
0.0 °C |