| Measure | Value (anomaly) | Time |
Month cumul. | Record High | Record Low |
| Minimum Temperature |
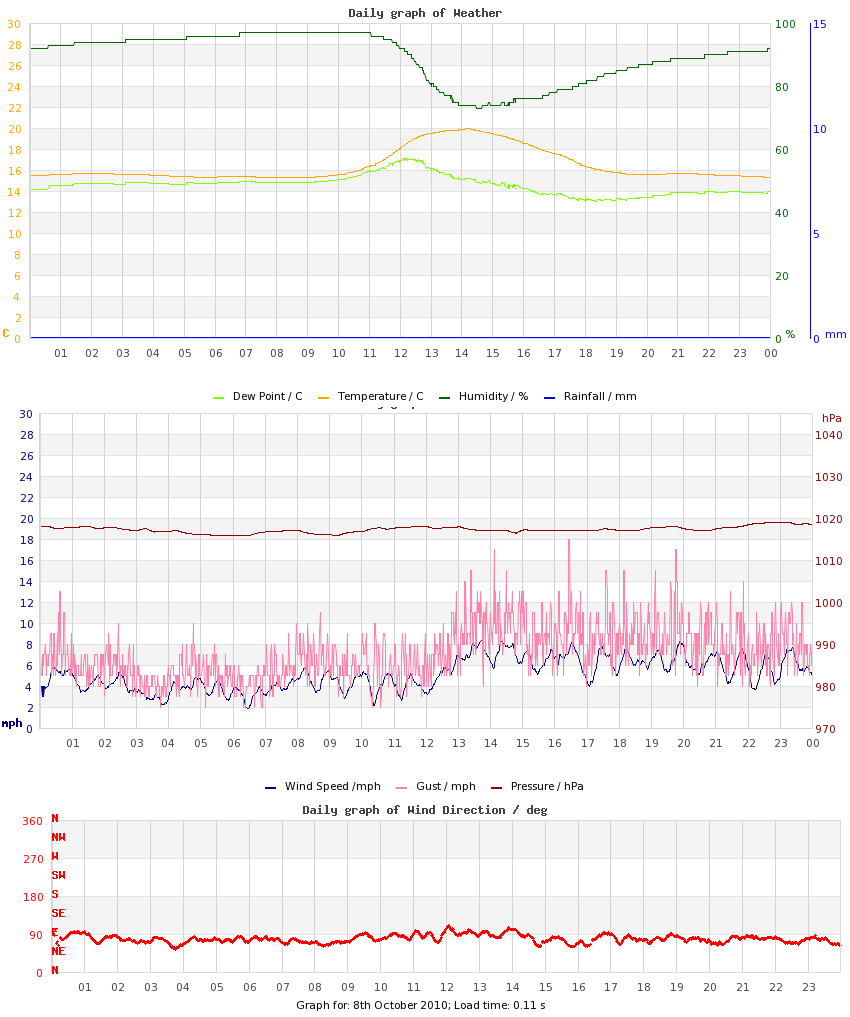
15.3 °C (+5.9) |
14:38 |
11.8 °C (+2.1) |
15.3 °C (+5.9), 2010 |
6.0 °C (-3.4), 2009 |
| Maximum Temperature |
20.0 °C (+4.1) |
14:11 |
17.3 °C (+1.1) |
23.9 °C (+8.0), 2023 |
11.8 °C (-4.1), 2012 |
| Mean Temperature |
16.4 °C (+5.0) |
|
14.5 °C (+1.6) |
18.4 °C, 2023 |
9.9 °C, 2009 |
| Minimum Humidity |
73% |
14:32 |
74% |
88%, 2012 |
56%, 2009 |
| Maximum Humidity |
97% |
08:54 |
97% |
98%, 2012 |
81%, 2016 |
| Mean Humidity |
89% |
|
89% |
95%, 2012 |
75%, 2016 |
| Minimum Pressure |
1015 hPa |
09:02 |
1002 hPa |
1029 hPa, 2021 |
990 hPa, 2024 |
| Maximum Pressure |
1017 hPa |
22:48 |
1009 hPa |
1032 hPa, 2021 |
995 hPa, 2024 |
| Mean Pressure |
1016 hPa |
|
1006 hPa |
1030 hPa, 2021 |
994 hPa, 2024 |
| Mean Wind Speed |
5.9 mph (+1.8) |
|
4.5 mph (+0.4) |
6.0 mph, 2019 |
0.7 mph, 2021 |
| Maximum Wind Speed |
13.7 mph |
|
12.6 mph |
18.1 mph, 2020 |
6.5 mph, 2021 |
| Maximum Gust |
20.8 mph |
16:26 |
19.6 mph |
28.9 mph, 2014 |
9.1 mph, 2021 |
| Mean Wind Direction |
E |
|
|
|
|
| Rainfall |
0.0 mm |
|
51.9 mm (309%) |
9.2 mm, 2024 |
|
| Maximum Hourly Rain |
n/a |
|
|
4.6, 2019 |
|
| Maximum 10-min Rain |
n/a |
|
|
2.6, 2019 |
|
| Maximum Rain Rate |
n/a |
|
|
42, 2024 |
|
| Minimum Dew Point |
13.0 °C |
18:19 |
10.0 °C |
13.0 °C, 2010 |
3.8 °C, 2009 |
| Maximum Dew Point |
17.1 °C |
12:12 |
15.2 °C |
17.1 °C, 2010 |
9.2 °C, 2009 |
| Mean Dew Point |
14.6 °C |
|
12.5 °C |
14.6 °C, 2010 |
6.4 °C, 2009 |
| Measure | Value | Time |
Month cumul. | Record High | Record Low |
| Night Minimum (21-09) |
* 14.5 °C * |
|
11.9 °C |
14.5 °C, 2010 |
6.0 °C, 2009 |
| Day Maximum (09-21) |
20.0 °C |
|
17.2 °C |
23.9 °C, 2023 |
11.8 °C, 2012 |
| Max 10m Temp Rise |
0.5 °C |
11:52 |
0.4 °C |
0.7 °C, 2015 |
0.2 °C, 2011 |
| Max 1hr Temp Rise |
2.1 °C |
12:26 |
1.4 °C |
2.9 °C, 2015 |
0.7 °C, 2012 |
| Max 1hr Hum Rise |
4% |
17:34 |
6% |
19%, 2019 |
3%, 2012 |
| Max 10m Temp Fall |
0.4 °C |
17:43 |
0.3 °C |
1.8 °C, 2019 |
0.1 °C, 2012 |
| Max 1hr Temp Fall |
1.2 °C |
17:57 |
1.0 °C |
3.6 °C, 2019 |
0.2 °C, 2012 |
| Max 1hr Hum Fall |
12% |
12:50 |
9% |
14%, 2014 |
2%, 2012 |
| Max 10m Wind Speed |
8.3 mph |
13:43 |
8.5 mph |
14.5 mph, 2014 |
3.8 mph, 2025 |
| Minimum Feels-like |
18.5 °C |
19:18 |
13.3 °C |
18.5 °C, 2010 |
4.7 °C, 2018 |
| Maximum Feels-like |
24.5 °C |
12:39 |
20.6 °C |
27.9 °C, 2023 |
13.7 °C, 2012 |
| Mean Feels-like |
20.2 °C |
|
17.1 °C |
21.9 °C, 2023 |
10.0 °C, 2009 |
| Air-frost Hrs |
0 hrs |
|
0 hrs |
0 hrs, 2009 |
0 hrs, 2009 |
| Measure | Value (anomaly) |
Month cumul. | Record High | Record Low |
| Temperature Range |
4.7 °C (-1.8) |
5.6 °C (-1.0) |
10.1 °C (+3.6), 2023 |
3.3 °C (-3.2), 2012 |
| Humidity Range |
24% |
23% |
41%, 2009 |
10%, 2012 |
| Pressure Range |
2 hPa |
7 hPa |
12 hPa, 2020 |
2 hPa, 2010 |
| Measure | Value [% of max] |
Month cumul. | Record High | Record Low |
| Sun Hours |
4 [40%] | 21 hrs (65%) [26%] |
10 [99%], 2022 |
0 [0%], 2012 |
| Wet Hours |
0 | 30 hrs (237%) [16%] |
7, 2012 |
0, 2009 |
| Cloud Cover |
am: Overcast transitioned to Mostly Sunny
pm: Mostly Sunny transitioned to Overcast |
| Events |
None |
| Comments |
misty morning (possible early am fog) |
| Extra Comments |
|
| Issues |
None known |
| Observer Absent? |
Yes - observations may be unreliable |
| Pond Temperature @ Hampstead Heath |
0.0 °C |