| Measure | Value (anomaly) | Time |
Month cumul. | Record High | Record Low |
| Minimum Temperature |
9.3 °C (+2.7) |
23:55 |
11.5 °C (+4.8) |
13.7 °C (+7.1), 2015 |
0.8 °C (-5.8), 2021 |
| Maximum Temperature |
16.8 °C (+4.9) |
10:56 |
15.6 °C (+3.5) |
16.8 °C (+4.9), 2010 |
8.5 °C (-3.4), 2012 |
| Mean Temperature |
15.0 °C (+3.8) |
|
13.9 °C (+4.2) |
15.0 °C, 2010 |
4.8 °C, 2020 |
| Minimum Humidity |
80% |
00:51 |
73% |
90%, 2011 |
60%, 2016 |
| Maximum Humidity |
93% |
19:09 |
91% |
98%, 2011 |
79%, 2016 |
| Mean Humidity |
87% |
|
83% |
94%, 2011 |
72%, 2016 |
| Minimum Pressure |
1016 hPa |
20:44 |
1010 hPa |
1036 hPa, 2020 |
967 hPa, 2023 |
| Maximum Pressure |
1021 hPa |
10:00 |
1017 hPa |
1042 hPa, 2020 |
994 hPa, 2023 |
| Mean Pressure |
1018 hPa |
|
1013 hPa |
1039 hPa, 2020 |
982 hPa, 2023 |
| Mean Wind Speed |
6.6 mph (+2.0) |
|
6.7 mph (+2.1) |
7.7 mph, 2016 |
0.2 mph, 2020 |
| Maximum Wind Speed |
16.1 mph |
|
15.7 mph |
20.8 mph, 2016 |
3.0 mph, 2020 |
| Maximum Gust |
23.5 mph |
15:38 |
25.0 mph |
35.5 mph, 2016 |
6.0 mph, 2020 |
| Mean Wind Direction |
WSW |
|
|
|
|
| Rainfall |
4.9 mm |
|
5.4 mm (48%) |
8.5 mm, 2013 |
|
| Maximum Hourly Rain |
1.9 mm |
22:08 |
|
3.7 mm, 2013 |
|
| Maximum 10-min Rain |
1.1 mm |
21:21 |
|
1.1 mm, 2010 |
|
| Maximum Rain Rate |
20 mm/h |
21:13 |
|
20 mm/h, 2010 |
|
| Minimum Dew Point |
8.2 °C |
23:04 |
8.9 °C |
12.4 °C, 2015 |
-2.2 °C, 2016 |
| Maximum Dew Point |
14.6 °C |
15:19 |
12.7 °C |
14.6 °C, 2010 |
4.5 °C, 2016 |
| Mean Dew Point |
12.8 °C |
|
11.0 °C |
13.2 °C, 2015 |
1.0 °C, 2016 |
| Measure | Value | Time |
Month cumul. | Record High | Record Low |
| Night Minimum (21-09) |
* 15.2 °C * |
|
12.4 °C |
15.2 °C, 2010 |
0.8 °C, 2021 |
| Day Maximum (09-21) |
16.8 °C |
|
15.5 °C |
16.8 °C, 2010 |
8.5 °C, 2012 |
| Max 10m Temp Rise |
0.2 °C |
08:37 |
0.2 °C |
0.6 °C, 2009 |
0.2 °C, 2010 |
| Max 1hr Temp Rise |
0.6 °C |
10:12 |
0.8 °C |
2.0 °C, 2017 |
0.6 °C, 2010 |
| Max 1hr Hum Rise |
9% |
22:33 |
6% |
9%, 2010 |
2%, 2015 |
| Max 10m Temp Fall |
1.2 °C |
21:32 |
0.4 °C |
1.2 °C, 2010 |
0.1 °C, 2022 |
| Max 1hr Temp Fall |
4.5 °C |
22:06 |
1.5 °C |
4.5 °C, 2010 |
0.1 °C, 2022 |
| Max 1hr Hum Fall |
9% |
21:29 |
7% |
19%, 2013 |
1%, 2022 |
| Max 10m Wind Speed |
10.2 mph |
16:45 |
10.3 mph |
16.2 mph, 2016 |
0.0 mph, 2020 |
| Minimum Feels-like |
8.2 °C |
23:54 |
11.9 °C |
16.2 °C, 2015 |
-2.3 °C, 2016 |
| Maximum Feels-like |
19.9 °C |
15:59 |
17.8 °C |
19.9 °C, 2010 |
6.7 °C, 2016 |
| Mean Feels-like |
17.7 °C |
|
15.6 °C |
17.7 °C, 2010 |
2.4 °C, 2016 |
| Air-frost Hrs |
0 hrs |
|
0 hrs |
0 hrs, 2009 |
0 hrs, 2009 |
| Measure | Value (anomaly) |
Month cumul. | Record High | Record Low |
| Temperature Range |
7.5 °C (+2.2) |
4.0 °C (-1.3) |
8.6 °C (+3.3), 2021 |
1.8 °C (-3.5), 2015 |
| Humidity Range |
13% |
18% |
32%, 2013 |
4%, 2015 |
| Pressure Range |
5 hPa |
7 hPa |
27 hPa, 2023 |
3 hPa, 2016 |
| Measure | Value [% of max] |
Month cumul. | Record High | Record Low |
| Sun Hours |
0.3 [4%] | 11 hrs (75%) [27%] |
7 [83%], 2021 |
0 [0%], 2015 |
| Wet Hours |
5
[Mean rain rate: 1.0 mm/h] | 5.5 hrs (52%) [4.6%] |
6, 2015 |
0, 2012 |
| Cloud Cover |
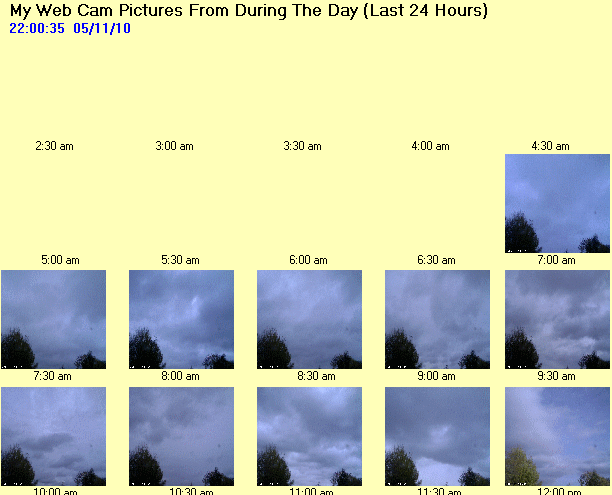
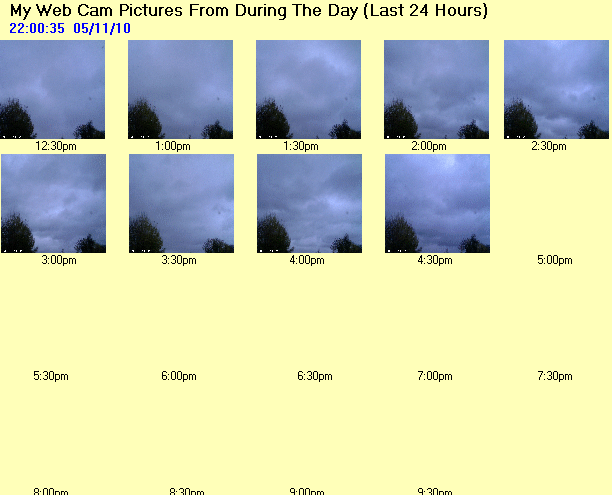
Overcast |
| Events |
None |
| Comments |
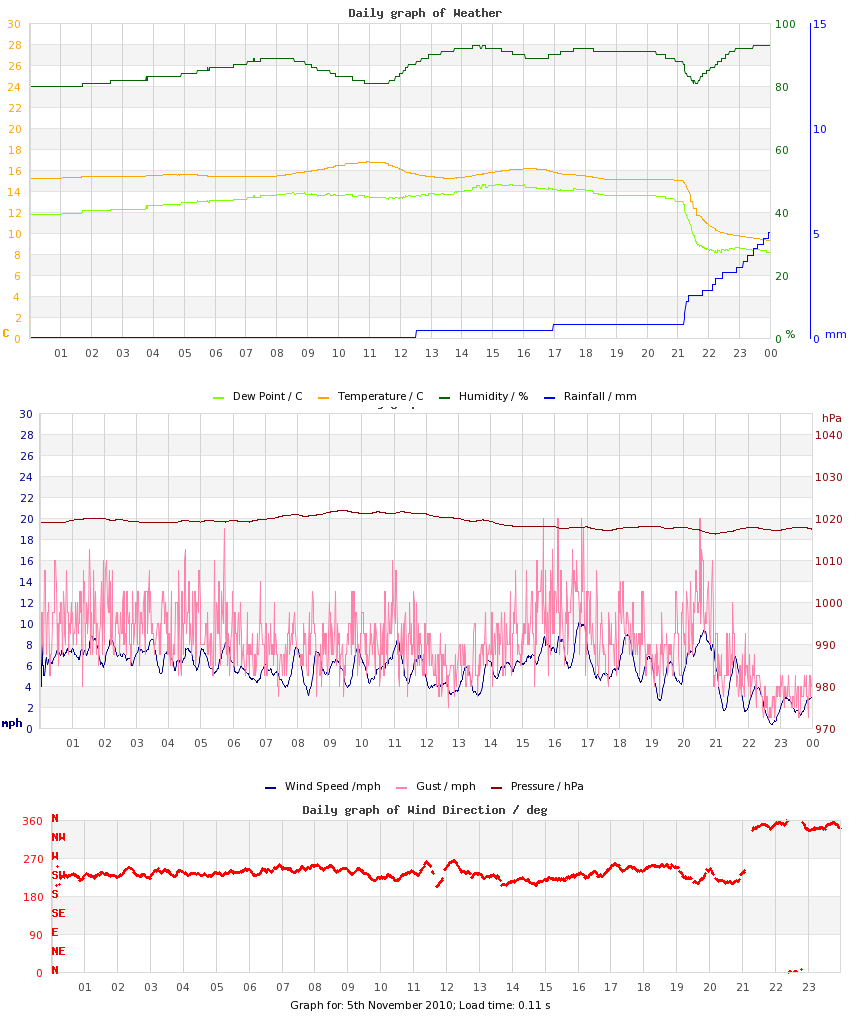
12-14, 16-17 Moderate Drizzle; 21-00 Moderate Rain (21 Very Heavy) |
| Extra Comments |
|
| Issues |
None known |
| Observer Absent? |
Yes - observations may be unreliable |
| Pond Temperature (Heath) |
0.0 °C |