| Measure | Value (anomaly) | Time |
Month cumul. | Record High | Record Low |
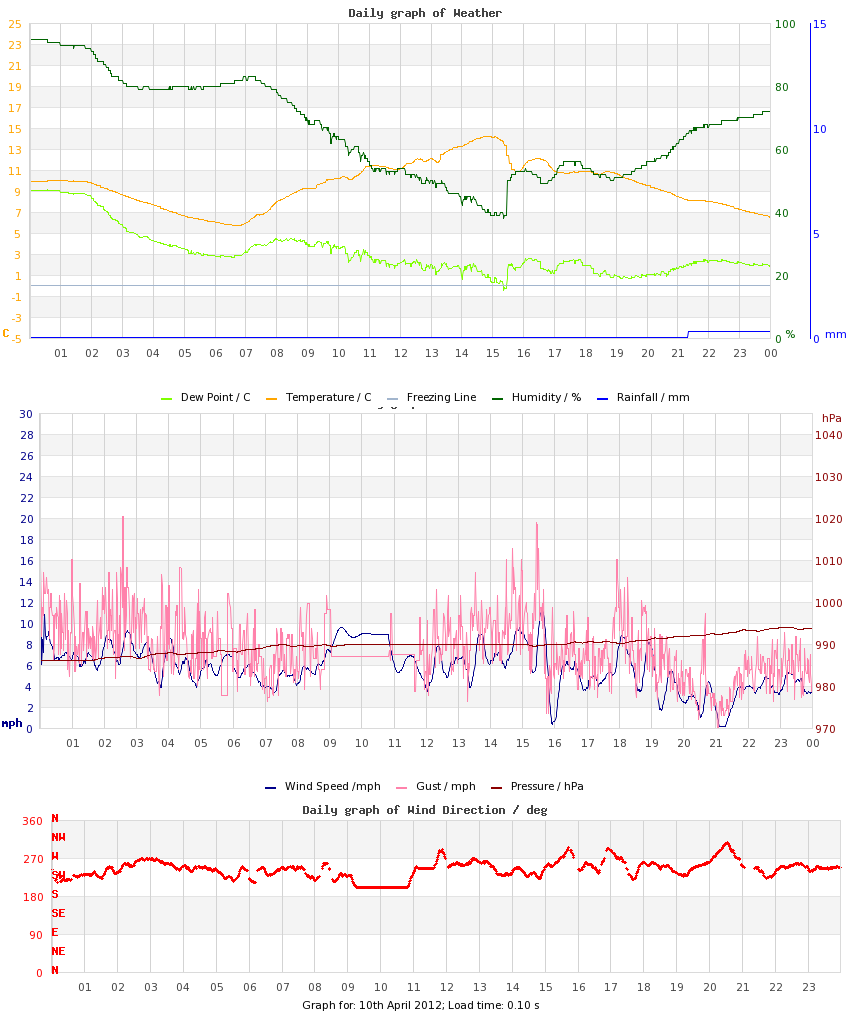
| Minimum Temperature |
5.7 °C (-0.0) |
06:41 |
3.6 °C (-2.0) |
10.1 °C (+4.3), 2009 |
0.6 °C (-5.2), 2022 |
| Maximum Temperature |
14.2 °C (+0.3) |
14:53 |
12.2 °C (-1.4) |
21.8 °C (+7.9), 2020 |
7.9 °C (-6.0), 2021 |
| Mean Temperature |
9.6 °C (+0.1) |
|
8.2 °C (-1.7) |
14.5 °C, 2020 |
6.2 °C, 2021 |
| Minimum Humidity |
38% |
15:19 |
50% |
81%, 2018 |
32%, 2015 |
| Maximum Humidity |
95% |
00:17 |
89% |
96%, 2018 |
71%, 2017 |
| Mean Humidity |
66% |
|
70% |
92%, 2018 |
56%, 2017 |
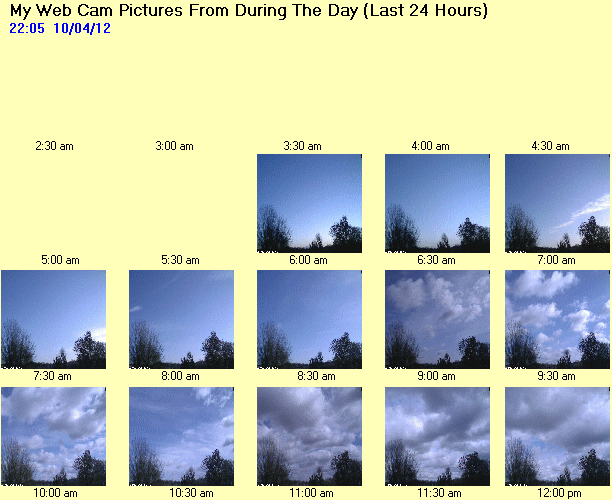
| Minimum Pressure |
986 hPa |
01:34 |
1004 hPa |
1030 hPa, 2010 |
986 hPa, 2012 |
| Maximum Pressure |
993 hPa |
22:49 |
1013 hPa |
1035 hPa, 2010 |
993 hPa, 2012 |
| Mean Pressure |
990 hPa |
|
1009 hPa |
1032 hPa, 2010 |
990 hPa, 2012 |
| Mean Wind Speed |
6.6 mph (+1.7) |
|
4.4 mph (-0.5) |
8.7 mph, 2023 |
2.1 mph, 2009 |
| Maximum Wind Speed |
17.3 mph |
|
12.7 mph |
20.5 mph, 2023 |
7.8 mph, 2010 |
| Maximum Gust |
23.2 mph |
02:33 |
17.9 mph |
33.4 mph, 2023 |
10.9 mph, 2014 |
| Mean Wind Direction |
WSW |
|
|
|
|
| Rainfall |
0.3 mm |
|
15.7 mm (112%) |
11.3 mm, 2023 |
|
| Maximum Hourly Rain |
n/a |
21:20 |
|
2, 2023 |
|
| Maximum 10-min Rain |
0.3 mm |
21:20 |
|
0.9 mm, 2023 |
|
| Maximum Rain Rate |
n/a |
00:00 |
|
14.4, 2023 |
|
| Minimum Dew Point |
-0.5 °C |
15:20 |
-0.8 °C |
7.7 °C, 2009 |
-2.4 °C, 2016 |
| Maximum Dew Point |
9.1 °C |
00:33 |
6.2 °C |
11.3 °C, 2023 |
3.8 °C, 2021 |
| Mean Dew Point |
3.2 °C |
|
2.7 °C |
9.3 °C, 2009 |
0.8 °C, 2016 |
| Measure | Value | Time |
Month cumul. | Record High | Record Low |
| Night Minimum (21-09) |
5.7 °C |
06:40 |
4.1 °C |
10.9 °C, 2009 |
0.6 °C, 2022 |
| Day Maximum (09-21) |
14.2 °C |
14:52 |
12.2 °C |
21.8 °C, 2020 |
7.9 °C, 2021 |
| Max 10m Temp Rise |
0.8 °C |
13:22 |
0.7 °C |
1.1 °C, 2022 |
0.3 °C, 2021 |
| Max 1hr Temp Rise |
2.1 °C |
08:33 |
2.7 °C |
4.5 °C, 2022 |
0.7 °C, 2021 |
| Max 1hr Hum Rise |
15% |
16:02 |
8% |
16%, 2023 |
3%, 2017 |
| Max 10m Temp Fall |
1.7 °C |
15:35 |
0.7 °C |
1.7 °C, 2012 |
0.4 °C, 2010 |
| Max 1hr Temp Fall |
3.3 °C |
15:43 |
1.9 °C |
3.3 °C, 2012 |
1.3 °C, 2014 |
| Max 1hr Hum Fall |
11% |
10:19 |
12% |
21%, 2016 |
6%, 2017 |
| Max 10m Wind Speed |
11.2 mph |
15:35 |
8.7 mph |
15.4 mph, 2023 |
5.5 mph, 2014 |
| Minimum Feels-like |
2.2 °C |
06:40 |
1.7 °C |
6.1 °C, 2020 |
-1.2 °C, 2013 |
| Maximum Feels-like |
14.2 °C |
14:40 |
12.3 °C |
23.4 °C, 2020 |
7.0 °C, 2021 |
| Mean Feels-like |
8.6 °C |
|
7.4 °C |
14.7 °C, 2020 |
4.3 °C, 2021 |
| Air-frost Hrs |
0 hrs |
|
0.5 hrs |
0 hrs, 2009 |
0 hrs, 2009 |
| Measure | Value (anomaly) |
Month cumul. | Record High | Record Low |
| Temperature Range |
8.5 °C (+0.3) |
8.6 °C (+0.6) |
15.2 °C (+7.0), 2015 |
3.8 °C (-4.4), 2009 |
| Humidity Range |
57% |
39% |
57%, 2012 |
15%, 2018 |
| Pressure Range |
7 hPa |
9 hPa |
11 hPa, 2015 |
1 hPa, 2011 |
| Measure | Value [% of max] |
Month cumul. | Record High | Record Low |
| Sun Hours |
7 [57%] | 42 hrs (81%) [35%] |
12 [98%], 2019 |
0 [0%], 2021 |
| Wet Hours |
0.5 | 31 hrs (199%) [13%] |
11, 2023 |
0, 2010 |
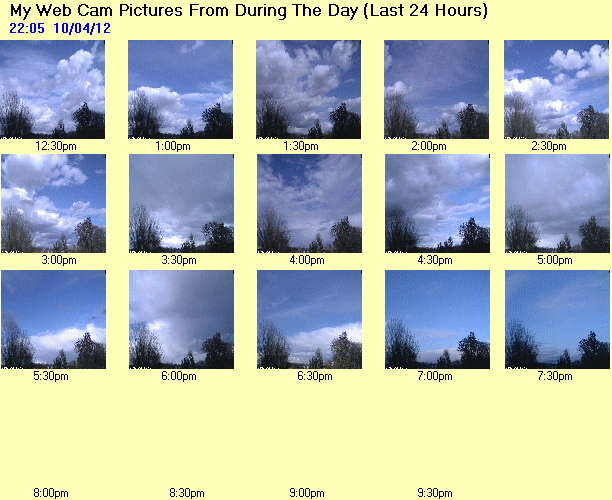
| Cloud Cover |
am: Mostly Sunny transitioned to Partly Cloudy
pm: Partly Cloudy |
| Events |
None |
| Comments |
1530, 17, 21 Light-Moderate Showers |
| Extra Comments |
|
| Issues |
Wind Data Loss (09-12) - not reconstructed |
| Observer Absent? |
Yes - observations may be unreliable |
| Pond Temperature (Heath) |
0.0 °C |